Square Enix 2012 Annual Report Download - page 32
Download and view the complete annual report
Please find page 32 of the 2012 Square Enix annual report below. You can navigate through the pages in the report by either clicking on the pages listed below, or by using the keyword search tool below to find specific information within the annual report.-
 1
1 -
2
-
3
-
4
-
5
-
6
-
7
-
8
-
9
-
10
-
11
-
12
-
13
-
14
-
15
-
16
-
17
-
18
-
19
-
20
-
21
-
 22
22 -
 23
23 -
 24
24 -
 25
25 -
 26
26 -
 27
27 -
 28
28 -
 29
29 -
 30
30 -
 31
31 -
 32
32 -
 33
33 -
 34
34 -
 35
35 -
 36
36 -
 37
37 -
 38
38 -
 39
39 -
 40
40 -
 41
41 -
 42
42 -
43
-
44
-
45
-
46
-
47
-
48
-
49
-
50
-
51
-
52
-
53
-
54
-
55
-
56
-
57
-
58
-
59
-
60
-
61
-
62
-
63
-
64
 |
 |

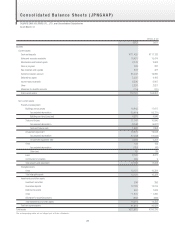
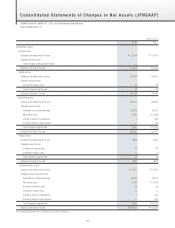
Consolidated Statements of Income (Loss) (JPNGAAP)
SQUARE ENIX HOLDINGS CO., LTD. and Consolidated Subsidiaries
Years ended March 31
Millions of yen
2012 2011
Net sales ¥127,896 ¥125,271
Cost of sales *1 76,268 *1 75,846
Gross profi t 51,627 49,424
Reversal of provision for sales returns 1,706 4,046
Provision for sales returns 1,502 1,779
Net gross profi t 51,831 51,691
Selling, general and administrative expenses
Packaging freight charge 1,812 2,336
Advertising expense 7,258 7,935
Sales promotion expense 63 67
Allowance for doubtful accounts 67 —
Compensation for directors 541 596
Salaries 12,195 12,534
Provision for bonuses 1,814 1,408
Net periodic pension costs 1,288 1,135
Provision for directors’ retirement benefi ts 13 15
Welfare expense 1,523 1,463
Rental expense 1,616 1,782
Commission fee 4,621 4,228
Depreciation and amortization 1,000 1,903
Other *2 7,298 *2 8,956
Total selling, general and administrative expenses 41,118 44,365
Operating income 10,713 7,325
Non-operating income
Interest income 136 95
Dividends received 436
Rental income 17 24
Miscellaneous income 127 190
Total non-operating income 286 347
Non-operating expenses
Interest expenses 61 59
Commission fee 100 44
Foreign exchange loss 536 2,149
Miscellaneous loss 328
Total non-operating expenses 701 2,282
Recurring income 10,297 5,390
Extraordinary gain
Gain on sale of property and equipment — *3 1
Gain on sale of investment securities 48 0
Gain on sale of stocks of subsidiaries and affi liates 192 —
Reversal of allowance for doubtful accounts —94
Gain on reversal of subscription rights to shares 46 125
Gain on disposition of foreign currency translation adjustments — 317
Other 18 94
Total extraordinary gain 305 633
Extraordinary loss
Loss on sale of property and equipment *4 30 *4 1
Loss on disposal of property and equipment *5 352 *5 621
Loss on liquidation of subsidiaries and affi liates — 136
Loss on evaluation of investment securities *6 0*6 175
Impairment loss *7 130 *7 8,853
Provision for game arcade closings 78 311
Loss on adjustment for changes of accounting standard for asset retirement obligations — 462
Loss related to content — *8 2,074
Loss on disposal of content and equipment *9 93 *9 2,398
Other 55 969
Total extraordinary loss 741 16,007
Income (loss) before dividends distribution from silent partnership, income taxes (tokumei-kumiai ) 9,862 (9,983)
Dividends distribution from silent partnership (tokumei-kumiai ) (4) (12)
Income (loss) before income taxes and minority interests 9,866 (9,970)
Income taxes–current 3,763 1,738
Refund of income taxes (50) (2,249)
Income taxes–deferred 79 2,594
Total income taxes 3,792 2,083
Income (loss) before minority interests 6,074 (12,054)
Minority interests income (loss) 13 (11)
Net income (loss) ¥ 6,060 ¥(12,043)
The accompanying notes are an integral part of these statements.
30