SkyWest Airlines 2013 Annual Report Download - page 96
Download and view the complete annual report
Please find page 96 of the 2013 SkyWest Airlines annual report below. You can navigate through the pages in the report by either clicking on the pages listed below, or by using the keyword search tool below to find specific information within the annual report.-
 1
1 -
2
-
3
-
4
-
5
-
6
-
7
-
8
-
9
-
10
-
11
-
12
-
13
-
14
-
15
-
16
-
17
-
18
-
19
-
20
-
21
-
22
-
23
-
24
-
25
-
26
-
27
-
28
-
29
-
30
-
31
-
32
-
33
-
34
-
35
-
36
-
37
-
38
-
39
-
40
-
41
-
42
-
43
-
44
-
45
-
46
-
47
-
48
-
49
-
50
-
51
-
52
-
53
-
54
-
55
-
56
-
57
-
58
-
59
-
60
-
61
-
62
-
63
-
64
-
65
-
66
-
67
-
68
-
69
-
70
-
71
-
72
-
73
-
74
-
75
-
76
-
77
-
78
-
79
-
80
-
81
-
82
-
83
-
84
-
85
-
 86
86 -
 87
87 -
 88
88 -
 89
89 -
 90
90 -
 91
91 -
 92
92 -
 93
93 -
 94
94 -
 95
95 -
 96
96 -
 97
97 -
 98
98 -
 99
99 -
 100
100 -
 101
101 -
 102
102 -
 103
103 -
 104
104 -
 105
105 -
 106
106 -
107
-
108
-
109
-
110
-
111
-
112
-
113
-
114
-
115
-
116
-
117
-
118
-
119
-
120
-
121
-
122
-
123
-
124
-
125
-
126
-
127
-
128
-
129
-
130
-
131
-
132
-
133
-
134
-
135
-
136
-
137
-
138
-
139
-
140
-
141
-
142
-
143
-
144
-
145
-
146
-
147
-
148
-
149
-
150
-
151
-
152
-
153
-
154
-
155
-
156
-
157
-
158
-
159
-
160
-
161
-
162
-
163
-
164
-
165
-
166
-
167
-
168
-
169
-
170
-
171
-
172
-
173
-
174
-
175
-
176
-
177
-
178
-
179
-
180
-
181
-
182
-
183
-
184
-
185
-
186
-
187
-
188
-
189
-
190
-
191
-
192
-
193
-
194
-
195
-
196
-
197
-
198
-
199
-
200
 |
 |

SKYWEST, INC. AND SUBSIDIARIES
NOTES TO CONSOLIDATED FINANCIAL STATEMENTS (Continued)
DECEMBER 31, 2013
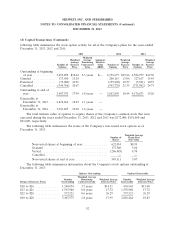
(8) Capital Transactions (Continued)
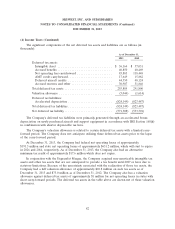
$13.41. The following table summarizes the restricted stock activity as of December 31, 2013, 2012 and
2011:
Weighted-Average
Number of Grant-Date Fair
Shares Value
Non-vested shares outstanding at December 31, 2010 . . . 659,263 18.97
Granted .................................... 249,502 15.51
Vested ..................................... (238,848) 25.80
Cancelled ................................... (58,315) 15.71
Non-vested shares outstanding at December 31, 2011 . . . 611,602 15.08
Granted .................................... 318,139 13.04
Vested ..................................... (212,841) 14.95
Cancelled ................................... (18,015) 14.20
Non-vested shares outstanding at December 31, 2012 . . . 698,885 14.21
Granted .................................... 312,104 13.41
Vested ..................................... (231,465) 14.35
Cancelled ................................... (45,933) 13.69
Non-vested shares outstanding at December 31, 2013 . . . 733,591 13.79
During the year ended December 31, 2013, 2012 and 2011, the Company recorded equity-based
compensation expense of $4.4 million, $4.7 million and $5.4 million, respectively.
As of December 31, 2013, the Company had $4.9 million of total unrecognized compensation cost
related to non-vested stock options and non-vested restricted stock grants. Total unrecognized
compensation cost will be adjusted for future changes in estimated forfeitures. The Company expects to
recognize this cost over a weighted average period of 1.7 years.
Options are exercisable for a period as defined by the Compensation Committee on the date
granted; however, no stock option will be exercisable before six months have elapsed from the date it is
granted and no incentive stock option shall be exercisable after ten years from the date of grant. The
91