SkyWest Airlines 2013 Annual Report Download - page 71
Download and view the complete annual report
Please find page 71 of the 2013 SkyWest Airlines annual report below. You can navigate through the pages in the report by either clicking on the pages listed below, or by using the keyword search tool below to find specific information within the annual report.-
 1
1 -
2
-
3
-
4
-
5
-
6
-
7
-
8
-
9
-
10
-
11
-
12
-
13
-
14
-
15
-
16
-
17
-
18
-
19
-
20
-
21
-
22
-
23
-
24
-
25
-
26
-
27
-
28
-
29
-
30
-
31
-
32
-
33
-
34
-
35
-
36
-
37
-
38
-
39
-
40
-
41
-
42
-
43
-
44
-
45
-
46
-
47
-
48
-
49
-
50
-
51
-
52
-
53
-
54
-
55
-
56
-
57
-
58
-
59
-
60
-
 61
61 -
 62
62 -
 63
63 -
 64
64 -
 65
65 -
 66
66 -
 67
67 -
 68
68 -
 69
69 -
 70
70 -
 71
71 -
 72
72 -
 73
73 -
 74
74 -
 75
75 -
 76
76 -
 77
77 -
 78
78 -
 79
79 -
 80
80 -
 81
81 -
82
-
83
-
84
-
85
-
86
-
87
-
88
-
89
-
90
-
91
-
92
-
93
-
94
-
95
-
96
-
97
-
98
-
99
-
100
-
101
-
102
-
103
-
104
-
105
-
106
-
107
-
108
-
109
-
110
-
111
-
112
-
113
-
114
-
115
-
116
-
117
-
118
-
119
-
120
-
121
-
122
-
123
-
124
-
125
-
126
-
127
-
128
-
129
-
130
-
131
-
132
-
133
-
134
-
135
-
136
-
137
-
138
-
139
-
140
-
141
-
142
-
143
-
144
-
145
-
146
-
147
-
148
-
149
-
150
-
151
-
152
-
153
-
154
-
155
-
156
-
157
-
158
-
159
-
160
-
161
-
162
-
163
-
164
-
165
-
166
-
167
-
168
-
169
-
170
-
171
-
172
-
173
-
174
-
175
-
176
-
177
-
178
-
179
-
180
-
181
-
182
-
183
-
184
-
185
-
186
-
187
-
188
-
189
-
190
-
191
-
192
-
193
-
194
-
195
-
196
-
197
-
198
-
199
-
200
 |
 |

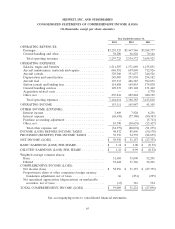
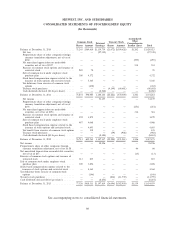
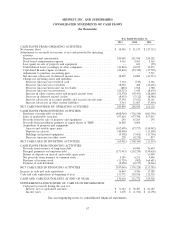
SKYWEST, INC. AND SUBSIDIARIES
CONSOLIDATED STATEMENTS OF STOCKHOLDERS’ EQUITY
(In thousands)
Accumulated
Other
Common Stock Treasury Stock
Retained Comprehensive
Shares Amount Earnings Shares Amount Income (Loss) Total
Balance at December 31, 2010 .............. 75,245 $589,610 $1,139,739 (21,072) $(309,628) $1,202 $1,420,923
Net loss ........................... ——(27,335) —— — (27,335)
Proportionate share of other companies foreign
currency translation adjustment, net of tax of
$180 ............................ —— —— —(295) (295)
Net unrealized appreciation on marketable
securities net of tax of $327 ............. —— —— — 534 534
Exercise of common stock options and issuance of
restricted stock ..................... 289 70 —— — — 70
Sale of common stock under employee stock
purchase plan ...................... 300 4,372 —— — — 4,372
Stock based compensation expense related to the
issuance of stock options and restricted stock . . — 5,365 —— — — 5,365
Tax deficiency from exercise of common stock
options .......................... —(432) —— — — (432)
Treasury stock purchases ................. —— —(4,149) (60,681) —(60,681)
Cash dividends declared ($0.16 per share) ...... ——(8,260) —— — (8,260)
Balance at December 31, 2011 .............. 75,834 598,985 1,104,144 (25,221) (370,309) 1,441 1,334,261
Net income ......................... ——51,157 —— — 51,157
Proportionate share of other companies foreign
currency translation adjustment, net of tax of
$154 ............................ —— —— —(251) (251)
Net unrealized appreciation on marketable
securities, net of tax of $194 ............. —— —— — 316 316
Exercise of common stock options and issuance of
restricted stock ..................... 392 1,879 —— — — 1,879
Sale of common stock under employee stock
purchase plan ...................... 487 4,068 —— — — 4,068
Stock based compensation expense related to the
issuance of stock options and restricted stock . . — 4,693 —— — — 4,693
Tax benefit from exercise of common stock options — 138 —— — — 138
Treasury stock purchases ................. —— —(59) (902) —(902)
Cash dividends declared ($0.16 per share) ...... ——(8,184) —— — (8,184)
Balance at December 31, 2012 .............. 76,713 609,763 1,147,117 (25,280) (371,211) 1,506 1,387,175
Net income .......................... ——58,956 —— — 58,956
Proportionate share of other companies foreign
currency translation adjustment, net of tax of $8 . . —— —— — 66 66
Net unrealized depreciation on marketable securities,
net of tax of $43 ...................... —— —— — (13) (13)
Exercise of common stock options and issuance of
restricted stock ...................... 313 835 —— — — 835
Sale of common stock under employee stock
purchase plan ....................... 300 3,696 —— — — 3,696
Stock based compensation expense related to the
issuance of stock options and restricted stock .... — 4,363 —— — — 4,363
Tax deficiency from exercise of common stock
options ........................... —(146) —— — — (146)
Treasury stock purchases .................. —— —(816) (11,739) —(11,739)
Cash dividends declared ($0.16 per share) ....... ——(8,254) —— — (8,254)
Balance at December 31, 2013 .............. 77,326 $618,511 $1,197,819 (26,096) $(382,950) $1,559 $1,434,939
See accompanying notes to consolidated financial statements.
66