SkyWest Airlines 2013 Annual Report Download - page 150
Download and view the complete annual report
Please find page 150 of the 2013 SkyWest Airlines annual report below. You can navigate through the pages in the report by either clicking on the pages listed below, or by using the keyword search tool below to find specific information within the annual report.-
 1
1 -
2
-
3
-
4
-
5
-
6
-
7
-
8
-
9
-
10
-
11
-
12
-
13
-
14
-
15
-
16
-
17
-
18
-
19
-
20
-
21
-
22
-
23
-
24
-
25
-
26
-
27
-
28
-
29
-
30
-
31
-
32
-
33
-
34
-
35
-
36
-
37
-
38
-
39
-
40
-
41
-
42
-
43
-
44
-
45
-
46
-
47
-
48
-
49
-
50
-
51
-
52
-
53
-
54
-
55
-
56
-
57
-
58
-
59
-
60
-
61
-
62
-
63
-
64
-
65
-
66
-
67
-
68
-
69
-
70
-
71
-
72
-
73
-
74
-
75
-
76
-
77
-
78
-
79
-
80
-
81
-
82
-
83
-
84
-
85
-
86
-
87
-
88
-
89
-
90
-
91
-
92
-
93
-
94
-
95
-
96
-
97
-
98
-
99
-
100
-
101
-
102
-
103
-
104
-
105
-
106
-
107
-
108
-
109
-
110
-
111
-
112
-
113
-
114
-
115
-
116
-
117
-
118
-
119
-
120
-
121
-
122
-
123
-
124
-
125
-
126
-
127
-
128
-
129
-
130
-
131
-
132
-
133
-
134
-
135
-
136
-
137
-
138
-
139
-
 140
140 -
 141
141 -
 142
142 -
 143
143 -
 144
144 -
 145
145 -
 146
146 -
 147
147 -
 148
148 -
 149
149 -
 150
150 -
 151
151 -
 152
152 -
 153
153 -
 154
154 -
 155
155 -
 156
156 -
 157
157 -
 158
158 -
 159
159 -
 160
160 -
161
-
162
-
163
-
164
-
165
-
166
-
167
-
168
-
169
-
170
-
171
-
172
-
173
-
174
-
175
-
176
-
177
-
178
-
179
-
180
-
181
-
182
-
183
-
184
-
185
-
186
-
187
-
188
-
189
-
190
-
191
-
192
-
193
-
194
-
195
-
196
-
197
-
198
-
199
-
200
 |
 |

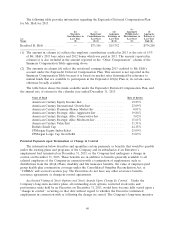
Grants of Plan-Based Awards For 2013
The following table provides information about non-equity based and equity-based plan awards
granted to the Executives for the year ended December 31, 2013:
(a) (b) (c) (d) (e) (f) (g) (h)
Estimated
Estimated Possible
Possible Payouts All Other
Payouts Under All Other Option
Under Equity Stock Awards:
Non-Equity Incentive Awards: Number of Exercise
Incentive Plan Plan Number of Securities Price of
Awards Awards Shares of Underlying Options Grant Date
Target Target Stock Options Awards Full Fair
Name Grant Date ($) (# shares) (# shares) (# shares) ($S/share)(1) Value(2)
Jerry C. Atkin ..... 13-Feb-2013(3)(4) $789,250 — 24,386 32,255 $13.24 $461,250
Bradford R. Rich . . . 13-Feb-2013(3)(4) $522,750 — 14,632 19,353 $13.24 $276,750
Russell A. Childs . . . 13-Feb-2013(3)(4) $442,680 — 12,391 16,389 $13.24 $234,360
Bradford R. Holt . . . 13-Feb-2013(3)(4) $442,680 — 12,391 16,389 $13.24 $234,360
Michael J. Kraupp . . 13-Feb-2013(3)(4) $208,684 — 5,326 7,045 $13.24 $100,744
(1) The exercise price of the options of $13.24 per share was the market closing price of the Common Stock on the
date of grant.
(2) Column (h) shows the full grant date fair market value of the options granted in 2013 as computed under ASC
Topic 718 and the expense attributable to restricted stock unit awards granted in 2013 (excluding the effect of
estimates for forfeitures). Assumptions and methodologies used in the calculation of these amounts are included in
footnotes to the Company’s audited financial statements for the year ended December 31, 2013, which are included
in the Company’s Annual Report on Form 10-K filed with the Securities and Exchange Commission.
(3) On February 13, 2013, the Company granted stock options, restricted stock units and performance unit awards
payable in cash pursuant to the 2010 Plan and the approved target annual performance bonus. Each Executive’s
target level of performance unit grant, earned in 2013 and payable in 2016, and target annual performance bonus,
earned in 2013 and payable in 2014, are included in the amount shown in column (c). The number of shares
underlying each Executive’s stock option grant earned in 2013, which vest in 2016, is listed in column (f). The
number of shares of Common Stock underlying each restricted stock unit award earned for year 2013 and payable in
2016 is shown in column (e). All of the long-term incentive awards included in columns (c) through (f), with the
exception of the target annual performance bonus included in column (c), vest on the third anniversary of the date
of grant (with earlier acceleration upon a change in control of the Company).
(4) As a result of the 2013 actual adjusted pretax earnings, Mr. Atkin received performance-based units payable in 2016
in cash having a value of $230,265; Mr. Rich received performance-based units payable in 2016 in cash having a
value of $138,375; Mr. Childs received performance-based units payable in 2016 in cash having a value of $117,180,
Mr. Holt received performance-based units payable in 2016 in cash having a value of $117,180 and Mr. Kraupp
received performance-based units payable in 2016 in cash having a value of $50,372. As a result of 2013 actual
performance, the amounts of annual performance bonus, excluding discretionary bonuses approved by the
Compensation Committee, earned in 2013 and paid in 2014 were: Mr. Atkin—$247,763; Mr. Rich—$184,900;
Mr. Childs—$211,601; Mr. Holt—$103,118; and Mr. Kraupp—$81,603.
36