SkyWest Airlines 2013 Annual Report Download - page 54
Download and view the complete annual report
Please find page 54 of the 2013 SkyWest Airlines annual report below. You can navigate through the pages in the report by either clicking on the pages listed below, or by using the keyword search tool below to find specific information within the annual report.-
 1
1 -
2
-
3
-
4
-
5
-
6
-
7
-
8
-
9
-
10
-
11
-
12
-
13
-
14
-
15
-
16
-
17
-
18
-
19
-
20
-
21
-
22
-
23
-
24
-
25
-
26
-
27
-
28
-
29
-
30
-
31
-
32
-
33
-
34
-
35
-
36
-
37
-
38
-
39
-
40
-
41
-
42
-
43
-
 44
44 -
 45
45 -
 46
46 -
 47
47 -
 48
48 -
 49
49 -
 50
50 -
 51
51 -
 52
52 -
 53
53 -
 54
54 -
 55
55 -
 56
56 -
 57
57 -
 58
58 -
 59
59 -
 60
60 -
 61
61 -
 62
62 -
 63
63 -
 64
64 -
65
-
66
-
67
-
68
-
69
-
70
-
71
-
72
-
73
-
74
-
75
-
76
-
77
-
78
-
79
-
80
-
81
-
82
-
83
-
84
-
85
-
86
-
87
-
88
-
89
-
90
-
91
-
92
-
93
-
94
-
95
-
96
-
97
-
98
-
99
-
100
-
101
-
102
-
103
-
104
-
105
-
106
-
107
-
108
-
109
-
110
-
111
-
112
-
113
-
114
-
115
-
116
-
117
-
118
-
119
-
120
-
121
-
122
-
123
-
124
-
125
-
126
-
127
-
128
-
129
-
130
-
131
-
132
-
133
-
134
-
135
-
136
-
137
-
138
-
139
-
140
-
141
-
142
-
143
-
144
-
145
-
146
-
147
-
148
-
149
-
150
-
151
-
152
-
153
-
154
-
155
-
156
-
157
-
158
-
159
-
160
-
161
-
162
-
163
-
164
-
165
-
166
-
167
-
168
-
169
-
170
-
171
-
172
-
173
-
174
-
175
-
176
-
177
-
178
-
179
-
180
-
181
-
182
-
183
-
184
-
185
-
186
-
187
-
188
-
189
-
190
-
191
-
192
-
193
-
194
-
195
-
196
-
197
-
198
-
199
-
200
 |
 |

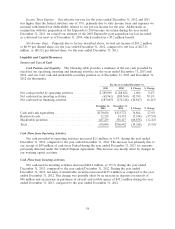
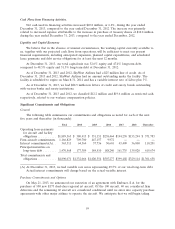
Revenues. Total operating revenues decreased $236.6 million, or 6.7%, during the year ended
December 31, 2013, compared to the year ended December 31, 2012. Under certain of our flying
contracts, certain expenses are subject to direct reimbursement from our major partners and we record
such reimbursements as passenger revenue.These reimbursed expenses include fuel, landing fees,
station rents and certain engine maintenance expenses. Our fuel expense, landing fees, station rents and
directly-reimbursed engine expense decreased by $331.0 million, during the year ended December 31,
2013, from the year ended December 31, 2012, due primarily (i) to our major partners purchasing an
increased volume of fuel, landing fees and station rents directly from vendors on flights we operated
under our code-share agreements and (ii) a reduction in the number of engine maintenance events.
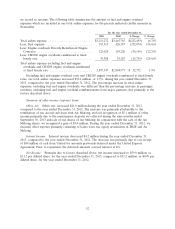
The following table summarizes the amount of fuel, landing fees, station rents, deice and engine
overhaul reimbursements included in our passenger revenues for the periods indicated (dollar amounts
in thousands).
For the year ended December 31,
2013 2012 $ Change % Change
Passenger revenues .......................... $3,239,525 $3,467,546 $(228,021) (6.6)%
Less: Fuel reimbursement from major partners ...... 91,925 329,748 (237,823) (72.1)%
Less: Landing fee and station rent reimbursements
from major partners ........................ 95,175 152,121 (56,946) (37.4)%
Less: Engine overhaul reimbursement from major
partners ................................ 123,024 159,220 (36,196) (22.7)%
Passenger revenue excluding fuel, landing fee, station
rent and engine overhaul reimbursements ........ $2,929,401 $2,826,457 $ 102,944 3.6%
Passenger revenues. Passenger revenues decreased $228.0 million, or 6.6%, during year ended
December 31, 2013, compared to the year ended December 31, 2012. Our passenger revenues,
excluding fuel, landing fee, station rent and engine overhaul reimbursements from major partners,
increased $102.9 million, or 3.6%, during the year ended December 31, 2013, compared to the year
ended December 31, 2012. The increase in passenger revenues, excluding fuel, landing fee, station rent
and engine overhaul reimbursements, was primarily due to an increase in block hours of 3.6% during
the year ended December 31, 2013, compared to the year ended December 31, 2012. The increase in
block hours was due primarily to an increase in total number of aircraft in operation. Block hour
production is a significant revenue driver in our flying contracts with our major partners.
Ground handling and other. Total ground handling and other revenues decreased $8.6 million, or
12.9%, during the year ended December 31, 2013, compared to the year ended December 31, 2012.
Revenue attributed to ground handling services for our aircraft is reflected in our consolidated
statements of comprehensive income under the heading ‘‘Operating Revenues—Passenger’’ and revenue
attributed to ground handling services we provide for third-party aircraft is reflected in our
consolidated statements of comprehensive income under the heading ‘‘Operating Revenues—Ground
handling and other.’’ The decrease was primarily related to the decrease in our ground handling for
other airlines and a reduction of rental revenue associated with the termination of an aircraft sub-lease
we had executed with Air Mekong.
49