SkyWest Airlines 2013 Annual Report Download - page 43
Download and view the complete annual report
Please find page 43 of the 2013 SkyWest Airlines annual report below. You can navigate through the pages in the report by either clicking on the pages listed below, or by using the keyword search tool below to find specific information within the annual report.-
 1
1 -
2
-
3
-
4
-
5
-
6
-
7
-
8
-
9
-
10
-
11
-
12
-
13
-
14
-
15
-
16
-
17
-
18
-
19
-
20
-
21
-
22
-
23
-
24
-
25
-
26
-
27
-
28
-
29
-
30
-
31
-
32
-
 33
33 -
 34
34 -
 35
35 -
 36
36 -
 37
37 -
 38
38 -
 39
39 -
 40
40 -
 41
41 -
 42
42 -
 43
43 -
 44
44 -
 45
45 -
 46
46 -
 47
47 -
 48
48 -
 49
49 -
 50
50 -
 51
51 -
 52
52 -
 53
53 -
54
-
55
-
56
-
57
-
58
-
59
-
60
-
61
-
62
-
63
-
64
-
65
-
66
-
67
-
68
-
69
-
70
-
71
-
72
-
73
-
74
-
75
-
76
-
77
-
78
-
79
-
80
-
81
-
82
-
83
-
84
-
85
-
86
-
87
-
88
-
89
-
90
-
91
-
92
-
93
-
94
-
95
-
96
-
97
-
98
-
99
-
100
-
101
-
102
-
103
-
104
-
105
-
106
-
107
-
108
-
109
-
110
-
111
-
112
-
113
-
114
-
115
-
116
-
117
-
118
-
119
-
120
-
121
-
122
-
123
-
124
-
125
-
126
-
127
-
128
-
129
-
130
-
131
-
132
-
133
-
134
-
135
-
136
-
137
-
138
-
139
-
140
-
141
-
142
-
143
-
144
-
145
-
146
-
147
-
148
-
149
-
150
-
151
-
152
-
153
-
154
-
155
-
156
-
157
-
158
-
159
-
160
-
161
-
162
-
163
-
164
-
165
-
166
-
167
-
168
-
169
-
170
-
171
-
172
-
173
-
174
-
175
-
176
-
177
-
178
-
179
-
180
-
181
-
182
-
183
-
184
-
185
-
186
-
187
-
188
-
189
-
190
-
191
-
192
-
193
-
194
-
195
-
196
-
197
-
198
-
199
-
200
 |
 |
5FEB201414340952
Stock Performance Graph
The following Performance Graph and related information shall not be deemed ‘‘soliciting material’’ or
‘‘filed’’ with the Securities and Exchange Commission,(the ‘‘Commission’’), nor shall such information be
incorporated by reference into any future filing under the Securities Act of 1933, as amended, or the
Securities Exchange Act of 1934, as amended (the ‘‘Exchange Act’’), except to the extent we specifically
incorporate it by reference into such filing.
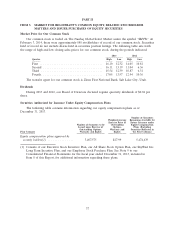
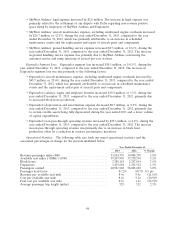
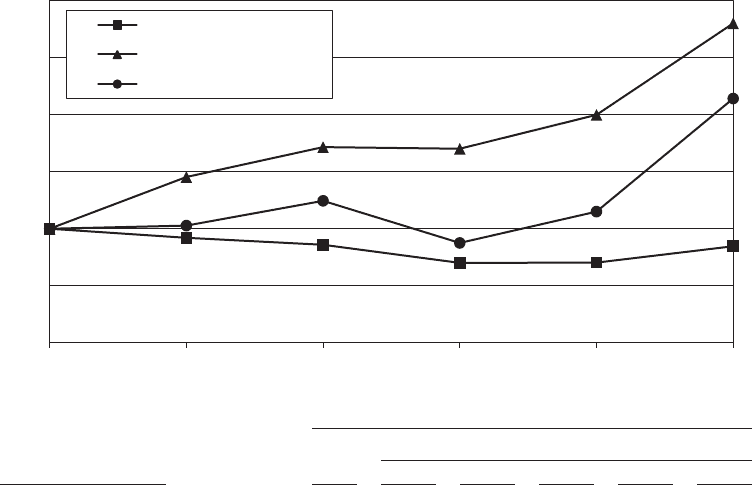
The following graph compares the cumulative total shareholder return on our common stock over
the five-year period ended December 31, 2013, with the cumulative total return during such period of
the Nasdaq Stock Market (U.S. Companies) and a peer group index composed of regional and major
passenger airlines with U.S operations that have equity securities traded on the Nasdaq Stock Market
or the New York Stock Exchange, the members of which are identified below (the ‘‘Peer Group’’) for
the same period. The following graph assumes an initial investment of $100.00 with dividends
reinvested. The stock performance shown on the graph below represents historical stock performance
and is not necessarily indicative of future stock price performance.
Comparison of Cumulative Five Year Total Return
$0
$50
$100
$300
$150
$200
$250
2008 2009 2010 2011 20132012
SkyWest, Inc.
NASDAQ Composite
Peer Group
INDEXED RETURNS
Base Years Ending
Period
Company Name / Index Dec08 Dec09 Dec10 Dec11 Dec12 Dec13
SkyWest, Inc. .............. 100 92.06 85.96 70.10 70.33 84.66
NASDAQ Composite ......... 100 145.32 171.50 170.08 199.76 279.90
Peer Group ............... 100 102.75 124.45 87.57 115.00 214.05
The Peer Group consists of regional and major passenger airlines with U.S operations that have
equity securities traded on the Nasdaq Stock Market or the New York Stock Exchange. The members
of the Peer Group are: Alaska Air Group, Inc.: Allegiant Travel Co.; American Airlines Group, Inc.;
Delta Air Lines, Inc.; Hawaiian Holdings, Inc.; JetBlue Airways, Corp.; Republic Airways,
Holdings Inc.; SkyWest, Inc. Southwest Airlines, Spirit Airlines Inc.; United Continental Holdings, Inc.;
and US Airways Group, Inc.
38