SkyWest Airlines 2013 Annual Report Download - page 84
Download and view the complete annual report
Please find page 84 of the 2013 SkyWest Airlines annual report below. You can navigate through the pages in the report by either clicking on the pages listed below, or by using the keyword search tool below to find specific information within the annual report.-
 1
1 -
2
-
3
-
4
-
5
-
6
-
7
-
8
-
9
-
10
-
11
-
12
-
13
-
14
-
15
-
16
-
17
-
18
-
19
-
20
-
21
-
22
-
23
-
24
-
25
-
26
-
27
-
28
-
29
-
30
-
31
-
32
-
33
-
34
-
35
-
36
-
37
-
38
-
39
-
40
-
41
-
42
-
43
-
44
-
45
-
46
-
47
-
48
-
49
-
50
-
51
-
52
-
53
-
54
-
55
-
56
-
57
-
58
-
59
-
60
-
61
-
62
-
63
-
64
-
65
-
66
-
67
-
68
-
69
-
70
-
71
-
72
-
73
-
 74
74 -
 75
75 -
 76
76 -
 77
77 -
 78
78 -
 79
79 -
 80
80 -
 81
81 -
 82
82 -
 83
83 -
 84
84 -
 85
85 -
 86
86 -
 87
87 -
 88
88 -
 89
89 -
 90
90 -
 91
91 -
 92
92 -
 93
93 -
 94
94 -
95
-
96
-
97
-
98
-
99
-
100
-
101
-
102
-
103
-
104
-
105
-
106
-
107
-
108
-
109
-
110
-
111
-
112
-
113
-
114
-
115
-
116
-
117
-
118
-
119
-
120
-
121
-
122
-
123
-
124
-
125
-
126
-
127
-
128
-
129
-
130
-
131
-
132
-
133
-
134
-
135
-
136
-
137
-
138
-
139
-
140
-
141
-
142
-
143
-
144
-
145
-
146
-
147
-
148
-
149
-
150
-
151
-
152
-
153
-
154
-
155
-
156
-
157
-
158
-
159
-
160
-
161
-
162
-
163
-
164
-
165
-
166
-
167
-
168
-
169
-
170
-
171
-
172
-
173
-
174
-
175
-
176
-
177
-
178
-
179
-
180
-
181
-
182
-
183
-
184
-
185
-
186
-
187
-
188
-
189
-
190
-
191
-
192
-
193
-
194
-
195
-
196
-
197
-
198
-
199
-
200
 |
 |

SKYWEST, INC. AND SUBSIDIARIES
NOTES TO CONSOLIDATED FINANCIAL STATEMENTS (Continued)
DECEMBER 31, 2013
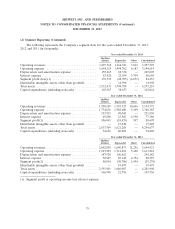
(2) Segment Reporting (Continued)
The following represents the Company’s segment data for the years ended December 31, 2013,
2012 and 2011 (in thousands).
Year ended December 31, 2013
SkyWest
Airlines ExpressJet Other Consolidated
Operating revenues ............................ 1,827,568 1,466,341 3,816 3,297,725
Operating expense ............................. 1,644,129 1,494,302 6,183 3,144,614
Depreciation and amortization expense .............. 155,667 89,338 — 245,005
Interest expense ............................... 43,920 21,034 3,704 68,658
Segment profit (loss)(1) ......................... 139,519 (48,995) (6,071) 84,453
Identifiable intangible assets, other than goodwill ....... — 14,998 — 14,998
Total assets .................................. 2,532,431 1,700,788 — 4,233,219
Capital expenditures (including non-cash) ............ 103,387 38,657 — 142,044
Year ended December 31, 2012
SkyWest
Airlines ExpressJet Other Consolidated
Operating revenues ............................ 1,930,149 1,593,527 10,696 3,534,372
Operating expense ............................. 1,774,876 1,588,400 5,109 3,368,385
Depreciation and amortization expense .............. 153,915 98,043 — 251,958
Interest expense .............................. 49,208 23,582 4,590 77,380
Segment profit(1) ............................. 106,065 (18,455) 997 88,607
Identifiable intangible assets, other than goodwill ...... — 17,248 — 17,248
Total assets .................................. 2,633,369 1,621,268 — 4,254,637
Capital expenditures (including non-cash) ............ 74,636 20,204 — 94,840
Year ended December 31, 2011
SkyWest
Airlines ExpressJet Other Consolidated
Operating revenues ............................ 2,002,830 1,640,837 11,256 3,654,923
Operating expense ............................. 1,893,909 1,714,481 5,428 3,613,818
Depreciation and amortization expense .............. 147,520 106,662 — 254,182
Interest expense .............................. 50,907 25,142 4,334 80,383
Segment profit(1) ............................. 58,014 (98,786) 1,494 (39,278)
Identifiable intangible assets, other than goodwill ...... — 19,497 — 19,497
Total assets .................................. 2,595,901 1,686,007 — 4,281,908
Capital expenditures (including non-cash) ............ 166,998 32,758 — 199,756
(1) Segment profit is operating income less interest expense
79