SkyWest Airlines 2013 Annual Report Download - page 63
Download and view the complete annual report
Please find page 63 of the 2013 SkyWest Airlines annual report below. You can navigate through the pages in the report by either clicking on the pages listed below, or by using the keyword search tool below to find specific information within the annual report.-
 1
1 -
2
-
3
-
4
-
5
-
6
-
7
-
8
-
9
-
10
-
11
-
12
-
13
-
14
-
15
-
16
-
17
-
18
-
19
-
20
-
21
-
22
-
23
-
24
-
25
-
26
-
27
-
28
-
29
-
30
-
31
-
32
-
33
-
34
-
35
-
36
-
37
-
38
-
39
-
40
-
41
-
42
-
43
-
44
-
45
-
46
-
47
-
48
-
49
-
50
-
51
-
52
-
 53
53 -
 54
54 -
 55
55 -
 56
56 -
 57
57 -
 58
58 -
 59
59 -
 60
60 -
 61
61 -
 62
62 -
 63
63 -
 64
64 -
 65
65 -
 66
66 -
 67
67 -
 68
68 -
 69
69 -
 70
70 -
 71
71 -
 72
72 -
 73
73 -
74
-
75
-
76
-
77
-
78
-
79
-
80
-
81
-
82
-
83
-
84
-
85
-
86
-
87
-
88
-
89
-
90
-
91
-
92
-
93
-
94
-
95
-
96
-
97
-
98
-
99
-
100
-
101
-
102
-
103
-
104
-
105
-
106
-
107
-
108
-
109
-
110
-
111
-
112
-
113
-
114
-
115
-
116
-
117
-
118
-
119
-
120
-
121
-
122
-
123
-
124
-
125
-
126
-
127
-
128
-
129
-
130
-
131
-
132
-
133
-
134
-
135
-
136
-
137
-
138
-
139
-
140
-
141
-
142
-
143
-
144
-
145
-
146
-
147
-
148
-
149
-
150
-
151
-
152
-
153
-
154
-
155
-
156
-
157
-
158
-
159
-
160
-
161
-
162
-
163
-
164
-
165
-
166
-
167
-
168
-
169
-
170
-
171
-
172
-
173
-
174
-
175
-
176
-
177
-
178
-
179
-
180
-
181
-
182
-
183
-
184
-
185
-
186
-
187
-
188
-
189
-
190
-
191
-
192
-
193
-
194
-
195
-
196
-
197
-
198
-
199
-
200
 |
 |

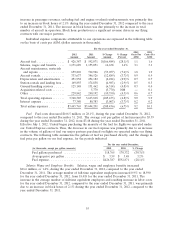
Income Taxes Expense. Our effective tax rate for the years ended December 31, 2012 and 2011
was higher than the federal statutory rate of 35%, primarily due to state income taxes and expenses we
incurred with limited tax deductibility relative to our pre-tax income for the year. Additionally, in
conjunction with the preparation of the ExpressJet’s 2010 income tax return during the year ended
December 31, 2011, we revised our estimate of the 2010 ExpressJet post-acquisition tax loss recorded
as a deferred tax asset as of December 31, 2010, which resulted in a $7.2 million benefit.
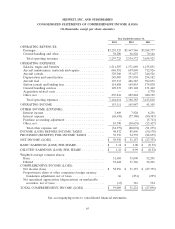
Net Income (loss). Primarily due to factors described above, we had net income of $51.2 million,
or $0.99 per diluted share, for the year ended December 31, 2012, compared to net loss of $(27.3)
million, or ($0.52) per diluted share, for the year ended December 31, 2011.
Liquidity and Capital Resources
Sources and Uses of Cash
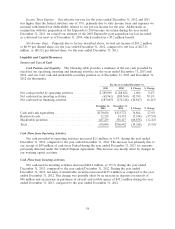
Cash Position and Liquidity. The following table provides a summary of the net cash provided by
(used in) our operating, investing and financing activities for the years ended December 31, 2013 and
2012, and our total cash and marketable securities position as of December 31, 2013 and December 31,
2012 (in thousands).
For the year ended December 31,
2013 2012 $ Change % Change
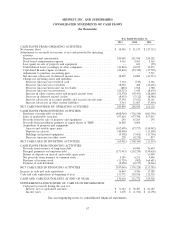
Net cash provided by operating activities ............. $289,890 $ 288,824 1,066 0.4%
Net cash used in investing activities ................. (65,961) (108,360) 42,399 39.1%
Net cash used in financing activities ................. (187,065) (176,218) (10,847) (6.2)%
December 31, December 31,
2013 2012 $ Change % Change
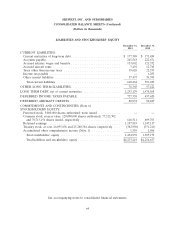
Cash and cash equivalents ...................... $170,636 $133,772 36,864 27.6%
Restricted cash .............................. 12,219 19,553 (7,334) (37.5)%
Marketable securities ......................... 487,239 556,117 (68,878) (12.4)%
Total ..................................... 670,094 $709,442 (39,348) (5.5)%
Cash Flows from Operating Activities.
Net cash provided by operating activities increased $1.1 million, or 0.4%, during the year ended
December 31, 2013, compared to the year ended December 31, 2012. The increase was primarily due to
our receipt of $49 million of cash from United during the year ended December 31, 2013 for amounts
previously deferred under the United Express Agreement. This increase was mostly offset by changes in
our working capital accounts.
Cash Flows from Investing Activities.
Net cash used in investing activities decreased $42.4 million, or 39.1% during the year ended
December 31, 2013, compared to the year ended December 31, 2012. During the year ended
December 31, 2013, net sales of marketable securities increased $127.4 million as compared to the year
ended December 31, 2012. This change was partially offset by an increase in deposits on aircraft of
$40 million and an increase in purchases of aircraft and rotable spares of $45.2 million during the year
ended December 31, 2013, compared to the year ended December 31, 2012.
58