SkyWest Airlines 2013 Annual Report Download - page 144
Download and view the complete annual report
Please find page 144 of the 2013 SkyWest Airlines annual report below. You can navigate through the pages in the report by either clicking on the pages listed below, or by using the keyword search tool below to find specific information within the annual report.
Executive to be adjusted in proportion to the extent to which the Company’s actual results varied from
the target level of performance. Specifically, (i) if pretax earnings had been equal to or greater than
$165 million, then 100% or more of the performance units would have been earned by the Executive;
(ii) if pretax earnings had ranged from $99 million to $165 million, then 50% to 100% of the
performance units would have been earned by the Executive; and (iii) if pretax earnings had been less
than $99 million, then no performance units would have been earned by the Executive.
The 2013 goal for each Executive was based on the Company’s targeted pretax earnings, and there
was no alternative operating company goal set for the Presidents of the operating subsidiaries, thus
encouraging teamwork and working towards the creation of long-term value for the Company’s
shareholders. In determining the degree to which the targeted pretax earnings goal has been attained,
pretax earnings are adjusted to exclude accounting timing differences between engine overhauls and
related revenue collected from contracts. Earned performance unit awards are paid in cash to reduce
share dilution and emphasize the real economic cost of officer incentives. The Company believes that
the performance unit grants provide an effective long-term incentive for the Executives to act in the
best interests of shareholders, by focusing on pretax earnings, which the Compensation Committee
believes is one of the principal contributing factors to long-term shareholder value.
For 2013, the actual adjusted shareholder pretax earnings was $99 million, which resulted in each
Executive earning 50% of his performance units (subject to risk of forfeiture in the event of
termination prior to February 13, 2016).
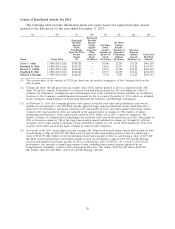
The targeted pretax earnings, actual pretax earnings, performance units granted, and the
performance units earned (subject to forfeiture if the vesting period is not met) for the year ended
December 31, 2013 were as follows:
Targeted Actual
Pretax Pretax Performance Performance
Earnings Earnings Units Units
(in Millions) (in Millions) Granted Earned
Jerry C. Atkin .............. $165 $99 $461,250 $230,265
Bradford R. Rich ............ $165 $99 $276,750 $138,375
Russell A. Childs ............ $165 $99 $234,360 $117,180
Bradford R. Holt ............ $165 $99 $234,360 $117,180
Michael J. Kraupp ........... $165 $99 $100,744 $ 50,372
The following table summarizes the number and nature of long-term awards granted to the
Executives by the Board on February 13, 2013.
Time Vested LTI Performance-Contingent LTI
Shares/Stock Shares/Stock Other Units
Options Units Options Units (Cash)(1)
Jerry C. Atkin ........................ 32,255 24,386 ——$461,250
Bradford R. Rich ...................... 19,353 14,632 ——$276,750
Russell A. Childs ...................... 16,389 12,391 ——$234,360
Bradford R. Holt ...................... 16,389 12,391 ——$234,360
Michael J. Kraupp ..................... 7,045 5,326 ——$100,744
(1) Number of performance units if 100% of target achieved. See table above for performance units
actually earned for 2013.
30


