SkyWest Airlines 2013 Annual Report Download - page 59
Download and view the complete annual report
Please find page 59 of the 2013 SkyWest Airlines annual report below. You can navigate through the pages in the report by either clicking on the pages listed below, or by using the keyword search tool below to find specific information within the annual report.-
 1
1 -
2
-
3
-
4
-
5
-
6
-
7
-
8
-
9
-
10
-
11
-
12
-
13
-
14
-
15
-
16
-
17
-
18
-
19
-
20
-
21
-
22
-
23
-
24
-
25
-
26
-
27
-
28
-
29
-
30
-
31
-
32
-
33
-
34
-
35
-
36
-
37
-
38
-
39
-
40
-
41
-
42
-
43
-
44
-
45
-
46
-
47
-
48
-
 49
49 -
 50
50 -
 51
51 -
 52
52 -
 53
53 -
 54
54 -
 55
55 -
 56
56 -
 57
57 -
 58
58 -
 59
59 -
 60
60 -
 61
61 -
 62
62 -
 63
63 -
 64
64 -
 65
65 -
 66
66 -
 67
67 -
 68
68 -
 69
69 -
70
-
71
-
72
-
73
-
74
-
75
-
76
-
77
-
78
-
79
-
80
-
81
-
82
-
83
-
84
-
85
-
86
-
87
-
88
-
89
-
90
-
91
-
92
-
93
-
94
-
95
-
96
-
97
-
98
-
99
-
100
-
101
-
102
-
103
-
104
-
105
-
106
-
107
-
108
-
109
-
110
-
111
-
112
-
113
-
114
-
115
-
116
-
117
-
118
-
119
-
120
-
121
-
122
-
123
-
124
-
125
-
126
-
127
-
128
-
129
-
130
-
131
-
132
-
133
-
134
-
135
-
136
-
137
-
138
-
139
-
140
-
141
-
142
-
143
-
144
-
145
-
146
-
147
-
148
-
149
-
150
-
151
-
152
-
153
-
154
-
155
-
156
-
157
-
158
-
159
-
160
-
161
-
162
-
163
-
164
-
165
-
166
-
167
-
168
-
169
-
170
-
171
-
172
-
173
-
174
-
175
-
176
-
177
-
178
-
179
-
180
-
181
-
182
-
183
-
184
-
185
-
186
-
187
-
188
-
189
-
190
-
191
-
192
-
193
-
194
-
195
-
196
-
197
-
198
-
199
-
200
 |
 |

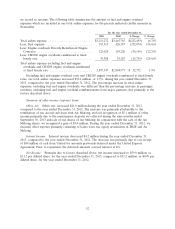
•ExpressJet salaries, wages and employee benefits decreased $7.8 million, primarily due to
integration benefits and aircraft scheduling inefficiencies experienced in 2011 that were not
replicated during 2012.
• Aircraft maintenance expense, excluding reimbursed engine overhauls, decreased $19.4 million,
primarily due to a reduction in scheduled maintenance events and more efficient maintenance
planning.
• Other expenses, primarily consisting of property taxes, hull and liability insurance, crew
simulator training and crew hotel costs, decreased $5.6 million, primarily due to a reduction in
new hire training from 2011.
• Non-aircraft depreciation and amortization expense decreased $5.0 million primarily due to
certain fixed assets becoming fully depreciated in 2012
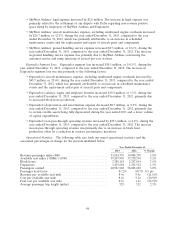
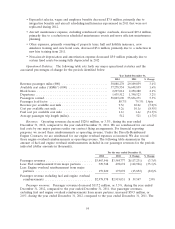
Operational Statistics. The following table sets forth our major operational statistics and the
associated percentages-of-change for the periods identified below.
Year Ended December 31,
2012 2011 % Change
Revenue passenger miles (000) .......................... 30,088,278 29,109,039 3.4%
Available seat miles (‘‘ASMs’’) (000) ...................... 37,278,554 36,698,859 1.6%
Block hours ........................................ 2,297,014 2,250,280 2.1%
Departures ......................................... 1,435,512 1,390,523 3.2%
Passengers carried .................................... 58,803,690 55,836,271 5.3%
Passenger load factor ................................. 80.7% 79.3% 1.4pts
Revenue per available seat mile .......................... 9.5¢ 10.0¢ (5.0)%
Cost per available seat mile ............................. 9.2¢ 10.1¢ (8.9)%
Fuel cost per available seat mile ......................... 1.1¢ 1.6¢ (31.3)%
Average passenger trip length (miles) ...................... 512 521 (1.7)%
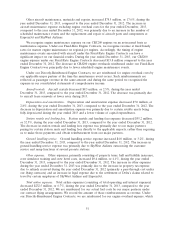
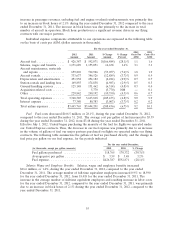
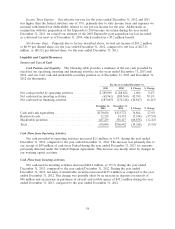
Revenues. Operating revenues decreased $120.6 million, or 3.3%, during the year ended
December 31, 2012, compared to the year ended December 31, 2011. We are reimbursed for our actual
fuel costs by our major partners under our contract flying arrangements. For financial reporting
purposes, we record these reimbursements as operating revenue. Under the Directly-Reimbursed
Engine Contracts, we are reimbursed for our engine overhaul expenses as incurred. We also record
those engine overhaul reimbursements as operating revenue. The following table summarizes the
amount of fuel and engine overhaul reimbursements included in our passenger revenues for the periods
indicated (dollar amounts in thousands).
For the year ended December 31,
2012 2011 $ Change % Change
Passenger revenues .......................... $3,467,546 $3,584,777 $(117,231) (3.3)%
Less: Fuel reimbursement from major partners ...... 329,748 492,674 (162,926) (33.1)%
Less: Engine overhaul reimbursement from major
partners ................................ 159,220 173,072 (13,852) (8.0)%
Passenger revenue excluding fuel and engine overhaul
reimbursements ........................... $2,978,578 $2,919,031 $ 59,547 2.0%
Passenger revenues. Passenger revenues decreased $117.2 million, or 3.3%, during the year ended
December 31, 2012, compared to the year ended December 31, 2011. Our passenger revenues,
excluding fuel and engine overhaul reimbursements from major partners, increased $59.5 million, or
2.0%, during the year ended December 31, 2012, compared to the year ended December 31, 2011. The
54