SkyWest Airlines 2011 Annual Report Download - page 74
Download and view the complete annual report
Please find page 74 of the 2011 SkyWest Airlines annual report below. You can navigate through the pages in the report by either clicking on the pages listed below, or by using the keyword search tool below to find specific information within the annual report.-
 1
1 -
2
-
3
-
4
-
5
-
6
-
7
-
8
-
9
-
10
-
11
-
12
-
13
-
14
-
15
-
16
-
17
-
18
-
19
-
20
-
21
-
22
-
23
-
24
-
25
-
26
-
27
-
28
-
29
-
30
-
31
-
32
-
33
-
34
-
35
-
36
-
37
-
38
-
39
-
40
-
41
-
42
-
43
-
44
-
45
-
46
-
47
-
48
-
49
-
50
-
51
-
52
-
53
-
54
-
55
-
56
-
57
-
58
-
59
-
60
-
61
-
62
-
63
-
 64
64 -
 65
65 -
 66
66 -
 67
67 -
 68
68 -
 69
69 -
 70
70 -
 71
71 -
 72
72 -
 73
73 -
 74
74 -
 75
75 -
 76
76 -
 77
77 -
 78
78 -
 79
79 -
 80
80 -
 81
81 -
 82
82 -
 83
83 -
 84
84 -
85
-
86
-
87
-
88
-
89
-
90
-
91
-
92
-
93
-
94
-
95
-
96
-
97
-
98
-
99
-
100
-
101
-
102
-
103
-
104
-
105
-
106
-
107
-
108
-
109
-
110
-
111
-
112
-
113
-
114
-
115
-
116
-
117
-
118
-
119
-
120
-
121
-
122
-
123
-
124
-
125
-
126
-
127
-
128
-
129
-
130
-
131
-
132
-
133
-
134
-
135
-
136
-
137
-
138
-
139
-
140
-
141
-
142
-
143
-
144
-
145
-
146
-
147
-
148
-
149
-
150
-
151
-
152
-
153
-
154
-
155
-
156
-
157
-
158
-
159
-
160
-
161
-
162
-
163
-
164
-
165
-
166
-
167
-
168
 |
 |

SKYWEST, INC. AND SUBSIDIARIES
NOTES TO CONSOLIDATED FINANCIAL STATEMENTS (Continued)
DECEMBER 31, 2011
(1) Nature of Operations and Summary of Significant Accounting Policies (Continued)
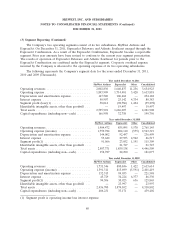
specific identification method, is recognized in other income and expense. The Company’s position in
marketable securities as of December 31, 2011 and 2010 was as follows (in thousands):
2011 2010
Investment Types Cost Market Value Cost Market Value
Commercial paper .............. 4,555 $ 4,557 $ 5,002 $ 4,998
Bond and bond funds ........... 496,170 496,310 669,786 669,025
Asset backed securities .......... 456 478 692 718
501,181 501,345 675,480 674,741
Unrealized appreciation
(depreciation) ............... 164 — (739) —
Total ....................... 501,345 501,345 674,741 674,741
Marketable securities had the following maturities as of December 31, 2011 (in thousands):
Maturities Amount
Year 2012 ............................................... $202,454
Years 2013 through 2016 .................................... 239,193
Years 2017 through 2021 .................................... 1,509
Thereafter ............................................... 58,189
As of December 31, 2011, the Company had classified $497.6 million of marketable securities as
short-term since it has the intent to maintain a liquid portfolio and the ability to redeem the securities
within one year. The Company has classified approximately $3.8 million of investments as non-current
and has identified them as ‘‘Other assets’’ in the Company’s consolidated balance sheet as of
December 31, 2011 (see Note 8).
Inventories
Inventories include expendable parts, fuel and supplies and are valued at cost (FIFO basis) less an
allowance for obsolescence based on historical results and management’s expectations of future
operations. Expendable inventory parts are charged to expense as used. An obsolescence allowance for
flight equipment expendable parts is accrued based on estimated lives of the corresponding fleet types
and salvage values. The inventory allowance as of December 31, 2011 and 2010 was $8.2 million and
$7.5 million, respectively. These allowances are based on management estimates, which are subject to
change.
70