SkyWest Airlines 2011 Annual Report Download - page 50
Download and view the complete annual report
Please find page 50 of the 2011 SkyWest Airlines annual report below. You can navigate through the pages in the report by either clicking on the pages listed below, or by using the keyword search tool below to find specific information within the annual report.-
 1
1 -
2
-
3
-
4
-
5
-
6
-
7
-
8
-
9
-
10
-
11
-
12
-
13
-
14
-
15
-
16
-
17
-
18
-
19
-
20
-
21
-
22
-
23
-
24
-
25
-
26
-
27
-
28
-
29
-
30
-
31
-
32
-
33
-
34
-
35
-
36
-
37
-
38
-
39
-
 40
40 -
 41
41 -
 42
42 -
 43
43 -
 44
44 -
 45
45 -
 46
46 -
 47
47 -
 48
48 -
 49
49 -
 50
50 -
 51
51 -
 52
52 -
 53
53 -
 54
54 -
 55
55 -
 56
56 -
 57
57 -
 58
58 -
 59
59 -
 60
60 -
61
-
62
-
63
-
64
-
65
-
66
-
67
-
68
-
69
-
70
-
71
-
72
-
73
-
74
-
75
-
76
-
77
-
78
-
79
-
80
-
81
-
82
-
83
-
84
-
85
-
86
-
87
-
88
-
89
-
90
-
91
-
92
-
93
-
94
-
95
-
96
-
97
-
98
-
99
-
100
-
101
-
102
-
103
-
104
-
105
-
106
-
107
-
108
-
109
-
110
-
111
-
112
-
113
-
114
-
115
-
116
-
117
-
118
-
119
-
120
-
121
-
122
-
123
-
124
-
125
-
126
-
127
-
128
-
129
-
130
-
131
-
132
-
133
-
134
-
135
-
136
-
137
-
138
-
139
-
140
-
141
-
142
-
143
-
144
-
145
-
146
-
147
-
148
-
149
-
150
-
151
-
152
-
153
-
154
-
155
-
156
-
157
-
158
-
159
-
160
-
161
-
162
-
163
-
164
-
165
-
166
-
167
-
168
 |
 |

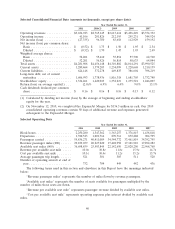
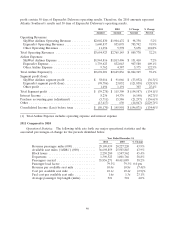
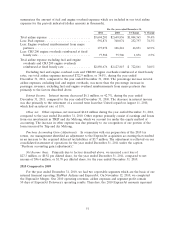
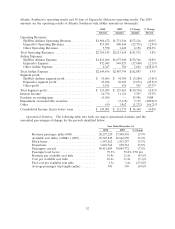
profit contain 50 days of ExpressJet Delaware operating results. Therefore, the 2010 amounts represent
Atlantic Southeast’s results and 50 days of ExpressJet Delaware’s operating results.
2011 2010 $ Change % Change
Amount Amount Amount Percent
Operating Revenues:
SkyWest Airlines Operating Revenue ........... $2,002,830 $1,904,472 $ 98,358 5.2%
ExpressJet Operating Revenues ............... 1,640,837 855,095 785,742 91.9%
Other Operating Revenues .................. 11,256 5,578 5,678 101.8%
Total Operating Revenues .................... $3,654,923 $2,765,145 $ 889,778 32.2%
Airline Expenses:
SkyWest Airlines Expense ................... $1,944,816 $1,813,406 $ 131,410 7.2%
ExpressJet Expense ........................ 1,739,623 832,043 907,580 109.1%
Other Airline Expense ..................... 9,762 4,387 5,375 122.5%
Total Airline Expense(1) ...................... $3,694,201 $2,649,836 $1,044,365 39.4%
Segment profit (loss):
SkyWest Airlines segment profit .............. $ 58,014 $ 91,066 $ (33,052) (36.3)%
ExpressJet segment profit (loss) ............... (98,786) 23,052 (121,838) (528.5)%
Other profit ............................. 1,494 1,191 303 25.4%
Total Segment profit ........................ $ (39,278) $ 115,309 $ (154,587) (134.1)%
Interest Income ............................ 8,236 14,376 (6,140) (42.7)%
Purchase accounting gain (adjustment) ........... (5,711) 15,586 (21,297) (136.6)%
Other ................................... (13,417) 630 (14,047) (2229.7)%
Consolidated Income (Loss) before taxes ......... $ (50,170) $ 145,901 $ (196,071) (134.4)%
(1) Total Airline Expense includes operating expense and interest expense
2011 Compared to 2010
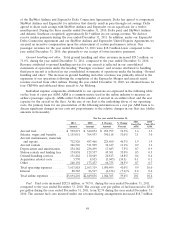
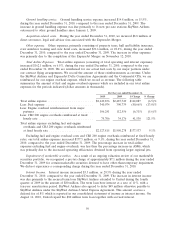
Operational Statistics. The following table sets forth our major operational statistics and the
associated percentages-of-change for the periods identified below.
Year Ended December 31,
2011 2010 % Change
Revenue passenger miles (000) ............. 29,109,039 20,227,220 43.9%
Available seat miles (‘‘ASMs’’) (000) ......... 36,698,859 25,503,845 43.9%
Block hours ........................... 2,250,280 1,547,562 45.4%
Departures ........................... 1,390,523 1,001,766 38.8%
Passengers carried ...................... 55,836,271 40,411,089 38.2%
Passenger load factor .................... 79.3% 79.3% 0.0 pts
Revenue per available seat mile ............ 10.0¢ 10.8¢ (7.4)%
Cost per available seat mile ............... 10.1¢ 10.4¢ (2.9)%
Fuel cost per available seat mile ............ 1.6¢ 1.3¢ 23.1%
Average passenger trip length (miles) ........ 521 501 4.0%
46