SkyWest Airlines 2011 Annual Report Download - page 52
Download and view the complete annual report
Please find page 52 of the 2011 SkyWest Airlines annual report below. You can navigate through the pages in the report by either clicking on the pages listed below, or by using the keyword search tool below to find specific information within the annual report.-
 1
1 -
2
-
3
-
4
-
5
-
6
-
7
-
8
-
9
-
10
-
11
-
12
-
13
-
14
-
15
-
16
-
17
-
18
-
19
-
20
-
21
-
22
-
23
-
24
-
25
-
26
-
27
-
28
-
29
-
30
-
31
-
32
-
33
-
34
-
35
-
36
-
37
-
38
-
39
-
40
-
41
-
 42
42 -
 43
43 -
 44
44 -
 45
45 -
 46
46 -
 47
47 -
 48
48 -
 49
49 -
 50
50 -
 51
51 -
 52
52 -
 53
53 -
 54
54 -
 55
55 -
 56
56 -
 57
57 -
 58
58 -
 59
59 -
 60
60 -
 61
61 -
 62
62 -
63
-
64
-
65
-
66
-
67
-
68
-
69
-
70
-
71
-
72
-
73
-
74
-
75
-
76
-
77
-
78
-
79
-
80
-
81
-
82
-
83
-
84
-
85
-
86
-
87
-
88
-
89
-
90
-
91
-
92
-
93
-
94
-
95
-
96
-
97
-
98
-
99
-
100
-
101
-
102
-
103
-
104
-
105
-
106
-
107
-
108
-
109
-
110
-
111
-
112
-
113
-
114
-
115
-
116
-
117
-
118
-
119
-
120
-
121
-
122
-
123
-
124
-
125
-
126
-
127
-
128
-
129
-
130
-
131
-
132
-
133
-
134
-
135
-
136
-
137
-
138
-
139
-
140
-
141
-
142
-
143
-
144
-
145
-
146
-
147
-
148
-
149
-
150
-
151
-
152
-
153
-
154
-
155
-
156
-
157
-
158
-
159
-
160
-
161
-
162
-
163
-
164
-
165
-
166
-
167
-
168
 |
 |

of the SkyWest Airlines and ExpressJet Delta Connection Agreements, Delta has agreed to compensate
SkyWest Airlines and ExpressJet for initiatives that directly result in pass through cost savings. Delta
agreed to share such savings with SkyWest Airlines and ExpressJet on an equal basis for a twelve-
month period. During the three months ended December 31, 2010, Delta paid, and SkyWest Airlines
and Atlantic Southeast recognized, approximately $6.9 million in cost savings revenue. We did not
receive similar payments during the year ended December 31, 2011. In addition, under our ExpressJet
Delta Connection Agreement and our SkyWest Airlines and ExpressJet United Express Agreements we
are paid an incentive compensation upon the achievement of certain performance criteria. Our
passenger revenues for the year ended December 31, 2011 were $18.9 million lower compared to the
year ended December 31, 2010, due primarily to our receipt of lower incentive payments.
Ground handling and other. Total ground handling and other revenues increased $29.3 million, or
71.6%, during the year ended December 31, 2011, compared to the year ended December 31, 2010.
Revenue attributed to ground handling services for our aircraft is reflected in our consolidated
statements of operations under the heading ‘‘Passenger revenues’’ and revenue attributed to handling
third party aircraft is reflected in our consolidated statements of operations under the heading ‘‘Ground
handling and other.’’ The increase in ground handling and other revenues was primarily related to the
expansion of our operations following the completion of the ExpressJet Merger and aircraft rental
revenue received from other airlines. During the year ended December 31, 2010, we obtained leases for
four CRJ900s and subleased those aircraft to Air Mekong.
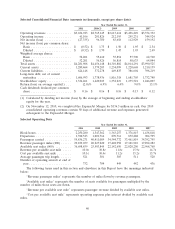
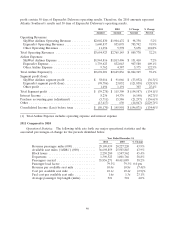
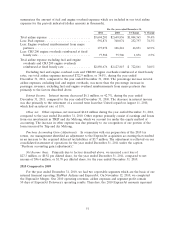
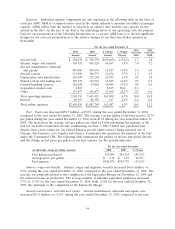
Individual expense components attributable to our operations are expressed in the following table
on the basis of cents per ASM. ASM is a common metric used in the airline industry to measure an
airline’s passenger capacity. ASMs reflect both the number of aircraft in an airline’s fleet and the seat
capacity for the aircraft in the fleet. As the size of our fleet is the underlying driver of our operating
costs, the primary basis for our presentation of the following information on a cost per ASM basis is to
discuss significant changes in our costs not proportionate to the relative changes in our fleet size (dollar
amounts in thousands).
For the year ended December 31,
2011 2010
2011 2010 $ Change % Change Cents Per Cents Per
Amount Amount Amount Percent ASM ASM
Aircraft fuel ............... $ 592,871 $ 340,074 $ 252,797 74.3% 1.6 1.3
Salaries, wages and benefits .... 1,155,051 764,933 390,118 51.0% 3.1 3.0
Aircraft maintenance, materials
and repairs .............. 712,926 487,466 225,460 46.3% 1.9 1.9
Aircraft rentals ............. 346,526 311,909 34,617 11.1% 0.9 1.2
Depreciation and amortization . . 254,182 236,499 17,683 7.5% 0.7 0.9
Station rentals and landing fees . 174,838 129,537 45,301 35.0% 0.5 0.5
Ground handling services ..... 131,462 110,649 20,813 18.8% 0.4 0.4
Acquisition related costs ...... 5,770 8,815 (3,045) (34.5) 0.1 0.1
Other .................... 240,192 173,437 66,755 38.5% 0.7 0.7
Total operating expenses ...... 3,613,818 2,563,319 1,050,499 41.0% 9.9 10.0
Interest .................. 80,383 86,517 (6,134) (7.1)% 0.2 0.4
Total airline expenses ........ $3,694,201 $2,649,836 1,044,365 39.4% 10.1 10.4
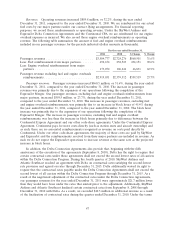
Fuel. Fuel costs increased $252.8 million, or 74.3%, during the year ended December 31, 2011,
compared to the year ended December 31, 2010. The average cost per gallon of fuel increased to $3.48
per gallon during the year ended December 31, 2011, from $2.74 during the year ended December 31,
2010. The amount fuel costs incurred under our revenue-sharing arrangements increased $18.7 million
48