SkyWest Airlines 2011 Annual Report Download - page 58
Download and view the complete annual report
Please find page 58 of the 2011 SkyWest Airlines annual report below. You can navigate through the pages in the report by either clicking on the pages listed below, or by using the keyword search tool below to find specific information within the annual report.-
 1
1 -
2
-
3
-
4
-
5
-
6
-
7
-
8
-
9
-
10
-
11
-
12
-
13
-
14
-
15
-
16
-
17
-
18
-
19
-
20
-
21
-
22
-
23
-
24
-
25
-
26
-
27
-
28
-
29
-
30
-
31
-
32
-
33
-
34
-
35
-
36
-
37
-
38
-
39
-
40
-
41
-
42
-
43
-
44
-
45
-
46
-
47
-
 48
48 -
 49
49 -
 50
50 -
 51
51 -
 52
52 -
 53
53 -
 54
54 -
 55
55 -
 56
56 -
 57
57 -
 58
58 -
 59
59 -
 60
60 -
 61
61 -
 62
62 -
 63
63 -
 64
64 -
 65
65 -
 66
66 -
 67
67 -
 68
68 -
69
-
70
-
71
-
72
-
73
-
74
-
75
-
76
-
77
-
78
-
79
-
80
-
81
-
82
-
83
-
84
-
85
-
86
-
87
-
88
-
89
-
90
-
91
-
92
-
93
-
94
-
95
-
96
-
97
-
98
-
99
-
100
-
101
-
102
-
103
-
104
-
105
-
106
-
107
-
108
-
109
-
110
-
111
-
112
-
113
-
114
-
115
-
116
-
117
-
118
-
119
-
120
-
121
-
122
-
123
-
124
-
125
-
126
-
127
-
128
-
129
-
130
-
131
-
132
-
133
-
134
-
135
-
136
-
137
-
138
-
139
-
140
-
141
-
142
-
143
-
144
-
145
-
146
-
147
-
148
-
149
-
150
-
151
-
152
-
153
-
154
-
155
-
156
-
157
-
158
-
159
-
160
-
161
-
162
-
163
-
164
-
165
-
166
-
167
-
168
 |
 |

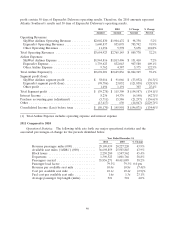
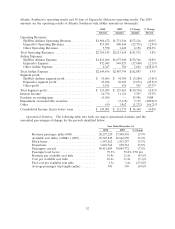
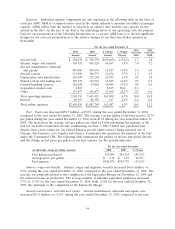
Expenses. Individual expense components are also expressed in the following table on the basis of
cents per ASM. ASM is a common metric used in the airline industry to measure an airline’s passenger
capacity. ASMs reflect both the number of aircraft in an airline’s fleet and the seat capacity for the
aircraft in the fleet. As the size of our fleet is the underlying driver of our operating costs, the primary
basis for our presentation of the following information on a cost per ASM basis is to discuss significant
changes in our costs not proportionate to the relative changes in our fleet size (dollar amounts in
thousands).
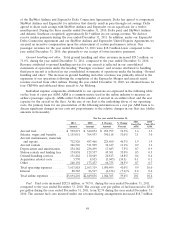
For the year ended December 31,
2010 2009
2010 2009 $ Change % Change Cents Per Cents Per
Amount Amount Amount Percent ASM ASM
Aircraft fuel ................ $ 340,074 $ 390,739 $(50,665) (13.0)% 1.3 1.8
Salaries, wages and benefits ..... 764,933 698,326 66,607 9.5% 3.0 3.2
Aircraft maintenance, materials
and repairs ............... 487,466 436,039 51,427 11.8% 1.9 2.0
Aircraft rentals .............. 311,909 300,773 11,136 3.7% 1.2 1.3
Depreciation and amortization . . . 236,499 221,548 14,951 6.7% 0.9 1.0
Station rentals and landing fees . . 129,537 116,312 13,225 11.4% 0.5 0.5
Ground handling services ....... 110,649 95,805 14,844 15.5% 0.4 0.4
Acquisition related costs ....... 8,815 — 8,815 N/A 0.1 —
Other ..................... 173,437 141,877 31,560 22.2% 0.7 0.6
Total operating expenses ....... 2,563,319 2,401,419 161,900 6.7% 10.0 10.8
Interest .................... 86,517 86,330 187 0.2% 0.4 0.4
Total airline expenses .......... $2,649,836 $2,487,749 162,087 6.5% 10.4 11.2
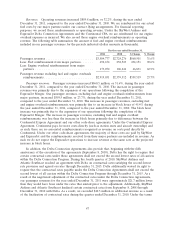
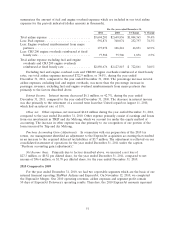
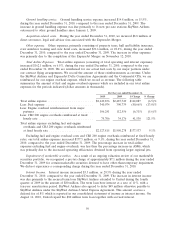
Fuel. Fuel costs decreased $50.7 million, or13.0%, during the year ended December 31, 2010,
compared to the year ended December 31, 2009. The average cost per gallon of fuel increased to $2.74
per gallon during the year ended December 31, 2010, from $1.87 during the year ended December 31,
2009. The increase in the average cost per gallon was offset by Delta purchasing the majority of the
fuel for our Delta Connection aircraft, commencing on June 1, 2009. United also purchased fuel
directly from a fuel vendor for our United Express aircraft under contract flying operated out of
Chicago, San Francisco, Los Angeles and Denver. Continental also purchases the majority of the fuel
under the Continental CPA. The following table summarizes the gallons of fuel we purchased directly,
and the change in fuel price per gallon on our fuel expense, for the periods indicated:
For the year ended December,
(in thousands, except per gallon amounts) 2010 2009 % Change
Fuel gallons purchased ..................... 124,094 209,254 (40.7)%
Average price per gallon .................... $ 2.74 $ 1.87 46.5%
Fuel expense ............................. $340,074 $390,739 (13.0)%
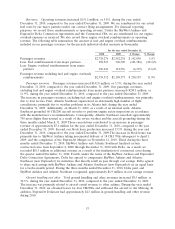
Salaries, wages and benefits. Salaries, wages and employee benefits increased $66.6 million, or
9.5%, during the year ended December 31, 2010, compared to the year ended December 31, 2009. The
increase was primarily related to the completion of the ExpressJet Merger on November 12, 2010 and
the related increase in production. The average number of full-time equivalent employees increased
5.7% to 13,363 for the year ended December 31, 2010, from 12,642 for the year ended December 31,
2009, due primarily to the completion of the ExpressJet Merger.
Aircraft maintenance, materials and repairs. Aircraft maintenance, materials and repair costs
increased $51.4 million, or 11.8%, during the year ended December 31, 2010, compared to the year
54