SkyWest Airlines 2011 Annual Report Download - page 61
Download and view the complete annual report
Please find page 61 of the 2011 SkyWest Airlines annual report below. You can navigate through the pages in the report by either clicking on the pages listed below, or by using the keyword search tool below to find specific information within the annual report.-
 1
1 -
2
-
3
-
4
-
5
-
6
-
7
-
8
-
9
-
10
-
11
-
12
-
13
-
14
-
15
-
16
-
17
-
18
-
19
-
20
-
21
-
22
-
23
-
24
-
25
-
26
-
27
-
28
-
29
-
30
-
31
-
32
-
33
-
34
-
35
-
36
-
37
-
38
-
39
-
40
-
41
-
42
-
43
-
44
-
45
-
46
-
47
-
48
-
49
-
50
-
 51
51 -
 52
52 -
 53
53 -
 54
54 -
 55
55 -
 56
56 -
 57
57 -
 58
58 -
 59
59 -
 60
60 -
 61
61 -
 62
62 -
 63
63 -
 64
64 -
 65
65 -
 66
66 -
 67
67 -
 68
68 -
 69
69 -
 70
70 -
 71
71 -
72
-
73
-
74
-
75
-
76
-
77
-
78
-
79
-
80
-
81
-
82
-
83
-
84
-
85
-
86
-
87
-
88
-
89
-
90
-
91
-
92
-
93
-
94
-
95
-
96
-
97
-
98
-
99
-
100
-
101
-
102
-
103
-
104
-
105
-
106
-
107
-
108
-
109
-
110
-
111
-
112
-
113
-
114
-
115
-
116
-
117
-
118
-
119
-
120
-
121
-
122
-
123
-
124
-
125
-
126
-
127
-
128
-
129
-
130
-
131
-
132
-
133
-
134
-
135
-
136
-
137
-
138
-
139
-
140
-
141
-
142
-
143
-
144
-
145
-
146
-
147
-
148
-
149
-
150
-
151
-
152
-
153
-
154
-
155
-
156
-
157
-
158
-
159
-
160
-
161
-
162
-
163
-
164
-
165
-
166
-
167
-
168
 |
 |

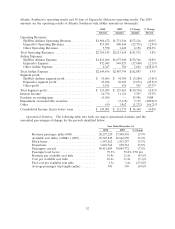
Purchase Accounting Gain. On November 12, 2010, we completed the ExpressJet Merger. As a
result of the ExpressJet Merger, we recorded a purchase accounting gain of $15.6 million on our
consolidated statements of operations for the year ended December 31, 2010. This amount represents
the difference between the consideration paid and the estimated net fair value of the tangible and
intangible assets acquired and liabilities assumed. The estimated net fair value of the assets and
liabilities acquired was more than the purchase price.
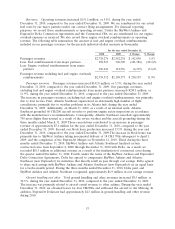
Income Taxes. The provision for income taxes, as a percentage of income before taxes, decreased
to 34.0% in 2010 from 36.5% in 2009. The reduction of 2.5% reflects the impact of a purchase
accounting gain that does not have a tax effect, resulting in a decrease in the rate of approximately
4.5%. This decrease was offset by an increase of approximately 2.0% resulting from a decrease in tax
exempt interest income and an increase in expenses not deductible for tax purposes.
Net Income. Primarily due to factors described above, net income increased to $96.4 million, or
$1.70 per diluted share, for the year ended December 31, 2010, compared to $83.7 million, or $1.47 per
diluted share, for the year ended December 31, 2009.
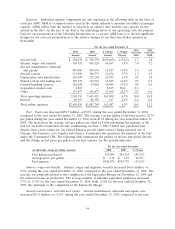
Liquidity and Capital Resources
Sources and Uses of Cash
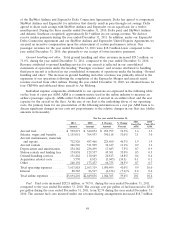
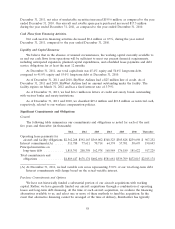
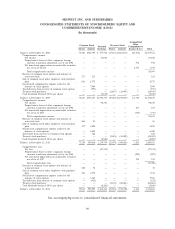
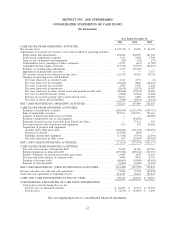
Cash Position and Liquidity. The following table provides a summary of the net cash provided by
(used in) our operating, investing and financing activities for the years ended December 31, 2011 and
2010, and our total cash and marketable securities position as of December 31, 2011 and December 31,
2010 (in thousands).
For the year ended December 31,
2011 2010 $ Change % Change
Net cash provided by operating
activities .................... $162,126 $ 347,089 $(184,963) (53.3)%
Net cash used in investing activities . . (11,553) (177,376) 165,823 93.5%
Net cash used in financing activities . . (133,385) (133,789) 404 (0.3)%
December 31, December 31,
2011 2010 $ Change % Change
Cash and cash equivalents ....... $129,526 $112,338 $ 17,188 15.3%
Restricted cash ............... 19,434 21,775 (2,341) (10.8)%
Marketable securities .......... 497,552 670,739 (173,187) (25.8)%
Total ...................... $646,512 $804,852 $(158,340) (19.7)%
Cash Flows from Operating Activities.
Net cash provided by operating activities decreased $185.0 million or 53.3%, during the year ended
December 31, 2011, compared to the year ended December 31, 2010. The decrease was primarily due
to the pre-tax loss we incurred during the year ended December 31, 2011, compared to the pre-tax
income we realized during the year ended December 31, 2010. During the year ended December 31,
2011, we had a pre-tax loss of $50.2 million, compared to pre-tax income of $145.9 million for the year
ended December 31, 2010.
Cash Flows from Investing Activities.
Net cash used in investing activities decreased $165.8 million or 93.5%, during the year ended
December 31, 2011, compared to the year ended December 31, 2010. During the year ended
57