Royal Caribbean Cruise Lines 2012 Annual Report Download - page 8
Download and view the complete annual report
Please find page 8 of the 2012 Royal Caribbean Cruise Lines annual report below. You can navigate through the pages in the report by either clicking on the pages listed below, or by using the keyword search tool below to find specific information within the annual report.-
 1
1 -
 2
2 -
 3
3 -
 4
4 -
 5
5 -
 6
6 -
 7
7 -
 8
8 -
 9
9 -
 10
10 -
 11
11 -
 12
12 -
 13
13 -
 14
14 -
 15
15 -
 16
16 -
 17
17 -
 18
18 -
 19
19 -
20
-
21
-
22
-
23
-
24
-
25
-
26
-
27
-
28
-
29
-
30
-
31
-
32
-
33
-
34
-
35
-
36
-
37
-
38
-
39
-
40
-
41
-
42
-
43
-
44
-
45
-
46
-
47
-
48
-
49
-
50
-
51
-
52
-
53
-
54
-
55
-
56
-
57
-
58
-
59
-
60
-
61
-
62
-
63
-
64
-
65
-
66
-
67
-
68
-
69
-
70
-
71
-
72
-
73
-
74
-
75
-
76
-
77
-
78
-
79
-
80
-
81
-
82
-
83
-
84
-
85
-
86
-
87
-
88
-
89
-
90
-
91
-
92
-
93
-
94
-
95
-
96
-
97
-
98
-
99
-
100
-
101
-
102
 |
 |

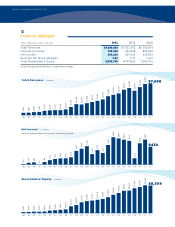
*Before cumulative effect of a change in accounting principle.
Net Income* $ millions
Shareholders’ Equity $ millions
Total Revenues $ millions
$523
$567
$698
$760
$1,013
$1,113
$1,171
$1,184
$1,357
$1,939
$2,636
$2,546
$2,866
$3,145
$3,434
$3,784
$4,555
$4,903
$5,230
$6,149
$6,533
$5,890
$7,688
$6,753
$7,537
$52
$42
$14
$4
$61
$107
$137
$149
$151
$175
$331
$384
$445
$254
$351
$281
$475
$663
$634
$603
$574
$152
$432
$607
$516
$295
$348
$400
$404
$464
$733
$846
$965
$1,085
$2,019
$2,455
$3,261
$3,616
$3,757
$4,035
$4,263
$4,805
$5,554
$6,092
$6,757
$6,803
$7,490
$8,309
$8,408
$7,901
’10’09 ’11’08’07’06’05’04’03’02’01’00’99’98’97’96’95’94’93’92’91’90’89’88 ’12
’10’09 ’11’08’07’06’05’04’03’02’01’00’99’98’97’96’95’94’93’92’91’90’89’88 ’12
’10’09 ’11’08’07’06’05’04’03’02’01’00’99’98’97’96’95’94’93’92’91’90’89’88 ’12
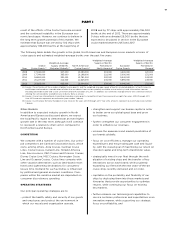
Financial Highlights
dollars in thousands, except per share data
Total Revenues
Operating Income1
Net Income1
Earnings Per Share (diluted)1
Total Shareholders’ Equity
12012 Excludes $413.9 million in impairment charges.
ROYAL CARIBBEAN CRUISES LTD.ROYAL CARIBBEAN CRUISES LTD.