Royal Caribbean Cruise Lines 2012 Annual Report Download - page 49
Download and view the complete annual report
Please find page 49 of the 2012 Royal Caribbean Cruise Lines annual report below. You can navigate through the pages in the report by either clicking on the pages listed below, or by using the keyword search tool below to find specific information within the annual report.-
 1
1 -
2
-
3
-
4
-
5
-
6
-
7
-
8
-
9
-
10
-
11
-
12
-
13
-
14
-
15
-
16
-
17
-
18
-
19
-
20
-
21
-
22
-
23
-
24
-
25
-
26
-
27
-
28
-
29
-
30
-
31
-
32
-
33
-
34
-
35
-
36
-
37
-
38
-
 39
39 -
 40
40 -
 41
41 -
 42
42 -
 43
43 -
 44
44 -
 45
45 -
 46
46 -
 47
47 -
 48
48 -
 49
49 -
 50
50 -
 51
51 -
 52
52 -
 53
53 -
 54
54 -
 55
55 -
 56
56 -
 57
57 -
 58
58 -
 59
59 -
60
-
61
-
62
-
63
-
64
-
65
-
66
-
67
-
68
-
69
-
70
-
71
-
72
-
73
-
74
-
75
-
76
-
77
-
78
-
79
-
80
-
81
-
82
-
83
-
84
-
85
-
86
-
87
-
88
-
89
-
90
-
91
-
92
-
93
-
94
-
95
-
96
-
97
-
98
-
99
-
100
-
101
-
102
 |
 |

45
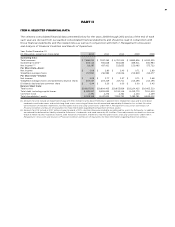
PART II
this measure. Accordingly, we do not believe that
reconciling information for such projected figures
would be meaningful.
Occupancy, in accordance with cruise vacation indus-
try practice, is calculated by dividing Passenger
Cruise Days by APCD. A percentage in excess of 100%
indicates that three or more passengers occupied
some cabins.
Passenger Cruise Days represent the number of
passengers carried for the period multiplied by the
number of days of their respective cruises.
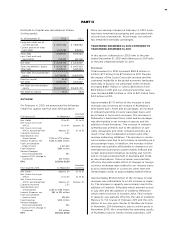
We believe that the impairment charges recognized
in 2012 related to Pullmantur’s goodwill, trademarks,
trade names and long-lived assets and the charges
related to the adjustments to Pullmantur’s deferred
tax assets and deferred tax liability (“the impairment
related charges”) are not an indication of our future
earnings performance. As such, we believe it is more
meaningful for the impairment related charges to be
excluded from our net income and earnings per share,
and accordingly, we have elected to also present
non-GAAP net income and non-GAAP EPS excluding
these impairment related charges for the year ended
December 31, 2012.
We believe Net Yields, Net Cruise Costs and Net
Cruise Costs Excluding Fuel are our most relevant
non-GAAP financial measures. However, a significant
portion of our revenue and expenses are denominated
in currencies other than the United States dollar.
Because our reporting currency is the United States
dollar, the value of these revenues and expenses can
be affected by changes in currency exchange rates.
Although such changes in local currency prices is just
one of many elements impacting our revenues and
expenses, it can be an important element. For this
reason, we also monitor Net Yields, Net Cruise Costs
and Net Cruise Costs Excluding Fuel as if the current
periods’ currency exchange rates had remained con-
stant with the comparable prior periods’ rates, or on
a “Constant Currency” basis.
It should be emphasized that Constant Currency is
primarily used for comparing short-term changes
and/or projections. Over the longer term, changes in
guest sourcing and shifting the amount of purchases
between currencies can significantly change the
impact of the purely currency-based fluctuations.
The use of certain significant non-GAAP measures,
such as Net Yields, Net Cruise Costs and Net Cruise
Costs Excluding Fuel, allow us to perform capacity
and rate analysis to separate the impact of known
capacity changes from other less predictable changes
which affect our business. We believe these non-GAAP
measures provide expanded insight to measure reve-
nue and cost performance in addition to the standard
United States GAAP based financial measures. There
are no specific rules or regulations for determining
non-GAAP and Constant Currency measures, and as
such, there exists the possibility that they may not be
comparable to other companies within the industry.
EXECUTIVE OVERVIEW
We believe our results of operations for 2012 demon-
strate the strength and resiliency of our brands and
the value proposition of a cruise vacation. Despite the
slow pace of the economic recovery and the continued
instability in the global economic landscape, especially
in Europe, our net income for 2012, before the impair-
ment related charges, was $432.2 million and our Net
Yields increased 1.5%. During the fourth quarter of
2012, we recognized an impairment charge of $385.4
million to write down Pullmantur’s goodwill to its
implied fair value and to write down trademarks and
trade names and certain long-lived assets, consisting
of three aircraft owned and operated by Pullmantur
Air, to their fair value. In addition, we recognized a
$33.7 million charge to record a 100% valuation allow-
ance related to our deferred tax assets for Pullmantur
and we reduced the deferred tax liability related to
Pullmantur’s trademarks and trade names by $5.2 mil-
lion. As a result, our net income for 2012 was $18.3
million as compared to $607.4 million for 2011, which
was not impacted by the impairment related charges.
Our results of operations for the year ended December
31, 2012 were also negatively impacted by the effect
of the Costa Concordia incident on booking patterns
throughout the industry. These effects were magni-
fied by the timing of the incident, which occurred in
early 2012 during WAVE season (traditionally the first
two months of the year where cruise lines experience
disproportionately higher volume cruise sales). We
continue to believe the impact of the Costa Concordia
incident will not have a significant long term impact
on our business.
Our results of operations were also influenced by
changes to our international distribution system
mainly in Brazil implemented in late 2011 pursuant
to which we began directly distributing certain of
our cruises rather than indirectly distributing them
through charter arrangements. In addition, our results
were impacted by certain deployment initiatives
including, but not limited to, increased deployment
in Australia and China.
Our continued focus on cost control has helped us to
maintain our profitability despite a tough operating
environment with upward pressure on costs. We intend