Royal Caribbean Cruise Lines 2012 Annual Report Download - page 54
Download and view the complete annual report
Please find page 54 of the 2012 Royal Caribbean Cruise Lines annual report below. You can navigate through the pages in the report by either clicking on the pages listed below, or by using the keyword search tool below to find specific information within the annual report.-
 1
1 -
2
-
3
-
4
-
5
-
6
-
7
-
8
-
9
-
10
-
11
-
12
-
13
-
14
-
15
-
16
-
17
-
18
-
19
-
20
-
21
-
22
-
23
-
24
-
25
-
26
-
27
-
28
-
29
-
30
-
31
-
32
-
33
-
34
-
35
-
36
-
37
-
38
-
39
-
40
-
41
-
42
-
43
-
 44
44 -
 45
45 -
 46
46 -
 47
47 -
 48
48 -
 49
49 -
 50
50 -
 51
51 -
 52
52 -
 53
53 -
 54
54 -
 55
55 -
 56
56 -
 57
57 -
 58
58 -
 59
59 -
 60
60 -
 61
61 -
 62
62 -
 63
63 -
 64
64 -
65
-
66
-
67
-
68
-
69
-
70
-
71
-
72
-
73
-
74
-
75
-
76
-
77
-
78
-
79
-
80
-
81
-
82
-
83
-
84
-
85
-
86
-
87
-
88
-
89
-
90
-
91
-
92
-
93
-
94
-
95
-
96
-
97
-
98
-
99
-
100
-
101
-
102
 |
 |

50
PART II
Croisières de France, on a two-month lag to allow for
more timely preparation of our consolidated financial
statements. (See Note 1. General to our consolidated
financial statements under Item 8. Financial State-
ments and Supplementary Data). The increase in
capacity was also partially offset by the delivery of
Ocean Dream to an unrelated third party in April 2012
as part of a six-year bareboat charter agreement.
Cruise Operating Expenses
Total cruise operating expenses for 2012 increased
$214.8 million or 4.3% to $5.2 billion from $4.9 billion
for 2011. Approximately $219.4 million of this increase
was attributable to increases in fuel expenses, and
expenses related to Pullmantur’s land-based tours,
hotel and air packages. Fuel expenses, which are
net of the financial impact of fuel swap agreements
accounted for as hedges, increased 15.2% per metric
ton in 2012 as compared to 2011 primarily as a result
of increasing fuel prices. The increase in Pullmantur’s
land-based tours, hotel and air packages expenses was
primarily attributable to an increase in guests and the
addition of new itineraries. These increases were par-
tially offset by a decrease in commissions expenses
attributable to increased charter business and changes
in our distribution channels. In addition, $69.9 million of
the increase in cruise operating expenses was attrib-
utable to the 1.4% increase in capacity mentioned
above. These increases in cruise operating expenses
were partially offset by the favorable effect of changes
in foreign currency exchange rates related to our
cruise operating expenses denominated in currencies
other than the United States dollar of approximately
$74.5 million.
Marketing, Selling and Administrative Expenses
Marketing, selling and administrative expenses for
2012 increased $50.9 million or 5.3% to $1.0 billion
from $960.6 million for 2011. The increase was due to
an increase in costs associated with investments in
technology and to an increase in advertising expenses
related to our global expansion. These increases were
partially offset by the favorable effect of changes in
foreign currency exchange rates related to our mar-
keting, selling and administrative expenses denomi-
nated in currencies other than the United States dollar.
Depreciation and Amortization Expenses
Depreciation and amortization expenses for 2012
increased $28.1 million or 4.0% to $730.5 million
from $702.4 million for 2011. The increase was primar-
ily due to the addition of Celebrity Silhouette which
entered service in July 2011, the addition of Celebrity
Reflection which entered service in October 2012 and
to new shipboard additions associated with our ship
revitalization projects. This increase was partially off-
set by the sale of Celebrity Mercury to TUI Cruises in
February 2011.
Impairment of Pullmantur Related Assets
During 2012, we recognized an impairment charge
of $385.4 million to write down Pullmantur’s good-
will to its implied fair value and to write down trade-
marks and trade names and certain long-lived assets,
consisting of three aircraft owned and operated by
Pullmantur Air, to their fair value. (See Valuation of
Goodwill, Indefinite-Lived Intangible Assets and Long-
Lived Assets above for more information regarding
the impairment of these assets).
Other Income (Expense)
Interest expense, net of interest capitalized, decreased
to $355.8 million in 2012 from $382.4 million in 2011.
The decrease was due to lower interest rates and a
lower average debt level.
Other expense was $50.4 million in 2012 compared
to other income of $32.9 million in 2011 for a net
change of $83.3 million when comparing these peri-
ods. The change in other expense was primarily due
to the following:
• Deferred income tax expense of $33.7 million as a
result of a 100% valuation allowance recorded in
connection with Pullmantur’s deferred tax assets
that are no longer expected to be recovered prior
to their expiration;
• A reduction in deferred income tax expense of $5.2
million due to a reduction in Pullmantur’s deferred
tax liability related to the impairment charge of
Pullmantur’s trademarks and trade names;
• A loss of $5.7 million associated with changes in
the fair value of our fuel call options in 2012 as
compared to a gain of $18.9 million in 2011, for a
net change of $24.6 million;
• A loss of $2.7 million due to ineffectiveness on our
fuel swaps in 2012 as compared to a gain of $7.1
million in 2011, for a net change of $9.8 million;
• A loss of $7.5 million on the early extinguishment
of €255.0 million, or approximately $328.0 million
in aggregate principal amount of our outstanding
€1.0 billion unsecured senior notes due 2014 in
September 2012.
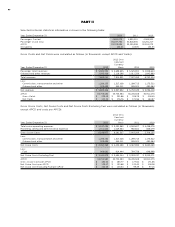
Net Yields
Net Yields increased 1.5% in 2012 compared to 2011
primarily due an increase in Pullmantur’s land-based
tours, hotel and air packages revenue and an increase
in onboard spending. In addition, the increase was
due to the changes in our international distribution
system mainly in Brazil and certain deployment initia-
tives. Net Yields increased 3.0% in 2012 compared to
2011 on a Constant Currency basis.