Royal Caribbean Cruise Lines 2012 Annual Report Download - page 53
Download and view the complete annual report
Please find page 53 of the 2012 Royal Caribbean Cruise Lines annual report below. You can navigate through the pages in the report by either clicking on the pages listed below, or by using the keyword search tool below to find specific information within the annual report.-
 1
1 -
2
-
3
-
4
-
5
-
6
-
7
-
8
-
9
-
10
-
11
-
12
-
13
-
14
-
15
-
16
-
17
-
18
-
19
-
20
-
21
-
22
-
23
-
24
-
25
-
26
-
27
-
28
-
29
-
30
-
31
-
32
-
33
-
34
-
35
-
36
-
37
-
38
-
39
-
40
-
41
-
42
-
 43
43 -
 44
44 -
 45
45 -
 46
46 -
 47
47 -
 48
48 -
 49
49 -
 50
50 -
 51
51 -
 52
52 -
 53
53 -
 54
54 -
 55
55 -
 56
56 -
 57
57 -
 58
58 -
 59
59 -
 60
60 -
 61
61 -
 62
62 -
 63
63 -
64
-
65
-
66
-
67
-
68
-
69
-
70
-
71
-
72
-
73
-
74
-
75
-
76
-
77
-
78
-
79
-
80
-
81
-
82
-
83
-
84
-
85
-
86
-
87
-
88
-
89
-
90
-
91
-
92
-
93
-
94
-
95
-
96
-
97
-
98
-
99
-
100
-
101
-
102
 |
 |

49
PART II
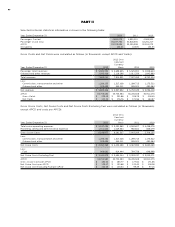
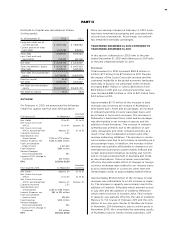
Net Debt-to-Capital was calculated as follows
(in thousands):
As of December 31,
Long-term debt, net of
current portion
Current portion of long-
term debt
Total debt
Less: Cash and cash
equivalents
Net Debt
Total shareholders’ equity
Total debt
Total debt and shareholders’
equity
Debt-to-Capital
Net Debt
Net Debt and shareholders’
equity
Net Debt-to-Capital
OUTLOOK
On February 4, 2013, we announced the following
initial first quarter and full year 2013 guidance:
Full Year 2013 AsReported
Constant
Currency
Net Yields to to
Net Cruise Costs per
APCD to Approx
Net Cruise Costs per
APCD, excluding Fuel Approx to
Capacity Increase
Depreciation and
Amortization tomillion
Interest Expense, net tomillion
Fuel Consumption
(metric tons)
Fuel Expenses million
Percent Hedged
(fwd consumption)
Impact of 10% change in
fuel prices million
EPS to
First Quarter 2013 AsReported
Constant
Currency
Net Yields Approx to
Net Cruise Costs per
APCD to to
Net Cruise Costs per
APCD, excluding Fuel Approx Approx
Capacity Increase
Depreciation and
Amortization tomillion
Interest Expense, net tomillion
Fuel Consumption
(metric tons)
Fuel Expenses million
Percent Hedged
(fwd consumption)
Impact of 10% change in
fuel prices million
EPS to
Since our earnings release on February 4, 2013, book-
ings have remained encouraging and consistent with
our previous expectations. Accordingly, our outlook
has remained essentially unchanged.
YEAR ENDED DECEMBER 31, 2012 COMPARED TO
YEAR ENDED DECEMBER 31, 2011
In this section, references to 2012 refer to the year
ended December 31, 2012 and references to 2011 refer
to the year ended December 31, 2011.
Revenues
Total revenues for 2012 increased $150.8 million or
2.0% to $7.7 billion from $7.5 billion in 2011. Despite
the impact of the Costa Concordia incident and the
continued instability in the global economic landscape,
especially in Europe, our passenger ticket revenues
increased $68.7 million or 1.2% to $5.6 billion from
$5.5 billion in 2011 and our onboard and other reve-
nues increased $82.1 million or 4.1% to $2.1 billion from
$2.0 billion in 2011.
Approximately $171.1 million of the increase in total
revenues was driven by an increase in Pullmantur’s
land-based tours, hotel and air packages, an increase
in onboard spending on a per passenger basis, and
an increase in concession revenues. The increase in
Pullmantur’s land-based tours, hotel and air packages
was attributable to an increase in guests and the
addition of new itineraries. The increase in onboard
spending was primarily due to the addition of spe-
cialty restaurants and other onboard activities as a
result of our ship revitalization projects and other
revenue enhancing initiatives. The increase in conces-
sion revenues was due to an increase in spending on a
per passenger basis. In addition, the increase in total
revenues was partially attributable to changes to our
international distribution system mainly in Brazil and
certain deployment initiatives including, but not lim-
ited to increased deployment in Australia and China
as described above. These increases were partially
offset by the unfavorable effect of changes in foreign
currency exchange rates related to our revenue trans-
actions denominated in currencies other than the
United States dollar of approximately $126.9 million.
Approximately $106.6 million of the increase in total
revenues was attributable to a 1.4% increase in capac-
ity. The increase in capacity was primarily due to the
addition of Celebrity Silhouette which entered service
in July 2011 and the addition of Celebrity Reflection
which entered service in October 2012. This increase
in capacity was partially offset by the sale of Celebrity
Mercury to TUI Cruises in February 2011 and the com-
pletion of our one-year charter of the Bleu de France
in November 2011 following its sale to a third party in
November 2010. We consolidate the operating results
of Pullmantur and its wholly-owned subsidiary, CDF