Royal Caribbean Cruise Lines 2012 Annual Report Download - page 56
Download and view the complete annual report
Please find page 56 of the 2012 Royal Caribbean Cruise Lines annual report below. You can navigate through the pages in the report by either clicking on the pages listed below, or by using the keyword search tool below to find specific information within the annual report.-
 1
1 -
2
-
3
-
4
-
5
-
6
-
7
-
8
-
9
-
10
-
11
-
12
-
13
-
14
-
15
-
16
-
17
-
18
-
19
-
20
-
21
-
22
-
23
-
24
-
25
-
26
-
27
-
28
-
29
-
30
-
31
-
32
-
33
-
34
-
35
-
36
-
37
-
38
-
39
-
40
-
41
-
42
-
43
-
44
-
45
-
 46
46 -
 47
47 -
 48
48 -
 49
49 -
 50
50 -
 51
51 -
 52
52 -
 53
53 -
 54
54 -
 55
55 -
 56
56 -
 57
57 -
 58
58 -
 59
59 -
 60
60 -
 61
61 -
 62
62 -
 63
63 -
 64
64 -
 65
65 -
 66
66 -
67
-
68
-
69
-
70
-
71
-
72
-
73
-
74
-
75
-
76
-
77
-
78
-
79
-
80
-
81
-
82
-
83
-
84
-
85
-
86
-
87
-
88
-
89
-
90
-
91
-
92
-
93
-
94
-
95
-
96
-
97
-
98
-
99
-
100
-
101
-
102
 |
 |

52
PART II
• Income on our investments in unconsolidated sub-
sidiaries of $22.2 million in 2011 as compared to
income of $0.2 million in 2010, for a net increase
of $22.0 million when comparing these periods;
• A gain on our fuel call options of $18.9 million in
2011 as compared to a loss of $2.8 million in 2010,
for a net change of $21.7 million.
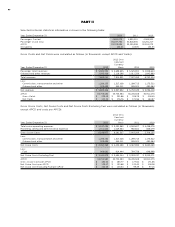
Net Yields
Net Yields increased 4.1% in 2011 compared to 2010
primarily due to an increase in ticket prices and the
favorable impact of changes in exchange rates, as dis-
cussed above. Net Yields per APCD increased 2.4% in
2011 compared to 2010 on a Constant Currency basis.
Net Cruise Costs
Net Cruise Costs increased 11.4% in 2011 compared to
2010 due to the 7.5% increase in capacity and a 3.7%
increase in Net Cruise Cost per APCD. The increase in
Net Cruise Costs per APCD was primarily driven by an
increase in fuel and other hotel and vessel expenses,
and to a lesser extent, the unfavorable impact of
changes in exchange rates, as discussed above. Net
Cruise Costs per APCD increased 2.7% in 2011 com-
pared to 2010 on a Constant Currency basis. Net
Cruise Costs Excluding Fuel per APCD increased 2.3%
in 2011 compared to 2010. Net Cruise Costs Excluding
Fuel per APCD increased 1.3% in 2011 compared to
2010 on a Constant Currency basis.
RECENTLY ADOPTED, AND FUTURE APPLICATION
OF, ACCOUNTING STANDARDS
Refer to Note 2. Summary of Significant Accounting
Policies to our consolidated financial statements under
Item 8. Financial Statements and Supplementary Data
for further information on Recently Adopted Account-
ing Standards and Recent Accounting Pronouncements.
LIQUIDITY AND CAPITAL RESOURCES
Sources and Uses of Cash
Cash flow generated from operations provides us with
a significant source of liquidity. Net cash provided by
operating activities decreased $74.0 million to $1.4
billion for 2012 compared to $1.5 billion for 2011. This
decrease was primarily a result of a decrease in net
income after adjusting for non-cash items and to the
timing of collections on our trade accounts receivable
partially offset by a higher rate of increase in cus-
tomer deposits and an increase in cash received on
the settlement of derivative financial instruments.
Net cash used in investing activities was $1.3 billion for
2012 compared to $924.6 million for 2011. The change
was primarily due to $290.0 million of proceeds
received from the sale of Celebrity Mercury and $55.0
million of proceeds received from the sale of Bleu de
France during 2011 which did not recur in 2012. During
2012, our use of cash was primarily related to capital
expenditures of $1.3 billion, up from $1.2 billion for
2011. The increase in capital expenditures was pri-
marily attributable to an increase in payments related
to our ship revitalization projects in 2012. We also
provided $110.7 million under a debt facility to one of
our unconsolidated affiliates during 2011 which did
not recur in 2012.
Net cash used in financing activities was $179.6 million
for 2012 compared to $676.5 million for 2011, primarily
as a result of our refinancing strategy for our upcom-
ing 2013 and 2014 maturities. The change was due
to a net increase in debt facility drawings of $980.1
million during 2012 as compared to 2011. The net
increase in debt facility drawings was primarily due to
proceeds received from the issuance of $650.0 mil-
lion unsecured senior notes and amounts borrowed
under an unsecured term loan of $290.0 million dur-
ing 2012 which did not occur in 2011. The change in
net cash used in financing activities was also due to
an increase in repayments of debt of approximately
$382.2 million. The increase in repayments of debt
was primarily due to an increase of $590.0 million in
repayments on our unsecured revolving credit facili-
ties from $885.0 million during 2011 to $1.5 billion dur-
ing 2012. The increase in repayments of debt was also
due $344.6 million paid in conjunction with the repur-
chase of €255.0 million or approximately $328.0 mil-
lion in aggregate principal amount of our €1.0 billion
5.625% unsecured senior notes and the prepayment
of a $100.0 million unsecured term loan during 2012
as compared to the repayment of a $500.0 million
unsecured senior note and a prepayment of $200.0
million on our Allure of the Seas unsecured term loan
during 2011. The change was also due to cash divi-
dends paid on our common stock of $117.7 million for
2012 as compared to $21.7 million for 2011.
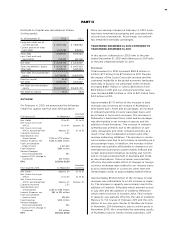
FUTURE CAPITAL COMMITMENTS
Our future capital commitments consist primarily of
new ship orders. As of December 31, 2012, we had
two Quantum-class ships and one Oasis-class ship on
order for our Royal Caribbean International brand
with an aggregate capacity of approximately 13,600
berths. The agreement for our Oasis-class ship is sub-
ject to certain closing conditions and is expected to
become effective in the first quarter of 2013. We also
have an option to construct a fourth Oasis-class ship
which will expire five days prior to the first anniversary
of the effective date of the contract.
As of December 31, 2012, the aggregate cost of our
ships on order was approximately $3.6 billion, of
which we had deposited $131.0 million as of such
date. Approximately 49.7% of the aggregate cost was
exposed to fluctuations in the euro exchange rate at