Rosetta Stone 2011 Annual Report Download - page 88
Download and view the complete annual report
Please find page 88 of the 2011 Rosetta Stone annual report below. You can navigate through the pages in the report by either clicking on the pages listed below, or by using the keyword search tool below to find specific information within the annual report.-
 1
1 -
2
-
3
-
4
-
5
-
6
-
7
-
8
-
9
-
10
-
11
-
12
-
13
-
14
-
15
-
16
-
17
-
18
-
19
-
20
-
21
-
22
-
23
-
24
-
25
-
26
-
27
-
28
-
29
-
30
-
31
-
32
-
33
-
34
-
35
-
36
-
37
-
38
-
39
-
40
-
41
-
42
-
43
-
44
-
45
-
46
-
47
-
48
-
49
-
50
-
51
-
52
-
53
-
54
-
55
-
56
-
57
-
58
-
59
-
60
-
61
-
62
-
63
-
64
-
65
-
66
-
67
-
68
-
69
-
70
-
71
-
72
-
73
-
74
-
75
-
76
-
77
-
 78
78 -
 79
79 -
 80
80 -
 81
81 -
 82
82 -
 83
83 -
 84
84 -
 85
85 -
 86
86 -
 87
87 -
 88
88 -
 89
89 -
 90
90 -
 91
91 -
 92
92 -
 93
93 -
 94
94 -
 95
95 -
 96
96 -
 97
97 -
 98
98 -
99
-
100
-
101
-
102
-
103
-
104
-
105
-
106
-
107
-
108
-
109
-
110
-
111
-
112
-
113
-
114
-
115
-
116
-
117
-
118
-
119
-
120
-
121
-
122
-
123
-
124
-
125
-
126
-
127
-
128
-
129
-
130
-
131
-
132
-
133
-
134
-
135
-
136
-
137
-
138
-
139
-
140
-
141
-
142
-
143
-
144
-
145
-
146
-
147
-
148
-
149
-
150
-
151
-
152
-
153
-
154
-
155
-
156
-
157
-
158
-
159
-
160
-
161
-
162
-
163
-
164
-
165
-
166
-
167
-
168
-
169
-
170
-
171
-
172
-
173
-
174
-
175
-
176
-
177
-
178
-
179
-
180
-
181
-
182
-
183
-
184
-
185
-
186
-
187
-
188
-
189
-
190
-
191
-
192
-
193
-
194
-
195
-
196
-
197
-
198
-
199
-
200
-
201
-
202
-
203
-
204
-
205
-
206
-
207
-
208
-
209
-
210
-
211
-
212
-
213
-
214
-
215
-
216
-
217
-
218
-
219
-
220
-
221
-
222
-
223
-
224
-
225
-
226
-
227
-
228
-
229
-
230
-
231
-
232
-
233
-
234
-
235
-
236
-
237
-
238
-
239
-
240
-
241
 |
 |

Table of Contents
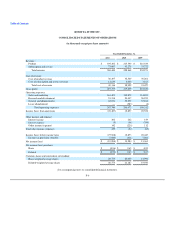
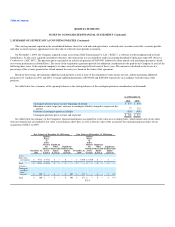
ROSETTA STONE INC.
CONSOLIDATED STATEMENTS OF CASH FLOWS
(in thousands)
Year Ended December 31,
2011 2010 2009
CASH FLOWS FROM OPERATING ACTIVITIES:
Net (loss) income $ (19,988) $ 13,284 $ 13,363
Adjustments to reconcile net income (loss) to cash provided by operating activities:
Stock-based compensation expense 12,353 4,387 22,150
Bad debt expense 1,228 1,750 911
Depreciation and amortization 8,724 6,615 5,428
Amortization of deferred financing costs — — 209
Deferred income tax benefit (1,297) (6,057) (2,475)
Loss on disposal of equipment 318 37 42
Net change in:
Restricted cash 11 (30) (16)
Accounts receivable (5,058) (12,260) (11,779)
Inventory 3,168 (935) (3,916)
Prepaid expenses and other current assets 659 (236) (1,006)
Income tax receivable (5,812) (5,028) —
Other assets (25) (761) (429)
Accounts payable (447) 5,987 (1,604)
Accrued compensation 1,200 (16) 1,905
Other current liabilities 3,979 6,106 5,678
Income tax payable — — 3,188
Excess tax benefit from stock options exercised (365) (1,377) (336)
Other long-term liabilities (52) (789) (463)
Deferred revenue 4,777 21,029 10,300
Net cash provided by operating activities 3,373 31,706 41,150
CASH FLOWS FROM INVESTING ACTIVITIES:
Purchases of property and equipment (9,940) (8,256) (8,455)
Purchases of available-for-sale securities (3,301) (6,410) —
Acquisition, net of cash acquired (75) (225) (100)
Net cash used in investing activities (13,316) (14,891) (8,555)
CASH FLOWS FROM FINANCING ACTIVITIES:
Proceeds from common stock issuance, net of issuance costs — — 49,037
Proceeds from the exercise of stock options 800 2,387 473
Tax benefit of stock options exercised 365 1,377 336
Payment of payroll taxes on net common stock issuance — — (7,887)
Payment of payroll taxes on stock options exercised — — (89)
Proceeds from long-term debt — — 9,929
Principal payments under long-term debt — — (19,839)
Payments under capital lease obligations and acquisition liabilities (285) (367) (3)
Net cash provided by financing activities 880 3,397 31,957
(Decrease) increase in cash and cash equivalents (9,063) 20,212 64,552
Effect of exchange rate changes in cash and cash equivalents (177) 356 10
Net increase (decrease) in cash and cash equivalents (9,240) 20,568 64,562
Cash and cash equivalents—beginning of year 115,756 95,188 30,626
Cash and cash equivalents—end of year $ 106,516 $ 115,756 $ 95,188
Supplemental Cash Flow Disclosure:
Cash paid during the periods for:
Interest $ 5 $ 66 $ 104
Income taxes $ 1,683 $ 9,989 $ 6,364
Noncash financing and investing activities:
Accrued liability for purchase of property , equipment and intangibles $ 204 $ 1,567 $ 546