Rosetta Stone 2011 Annual Report Download - page 70
Download and view the complete annual report
Please find page 70 of the 2011 Rosetta Stone annual report below. You can navigate through the pages in the report by either clicking on the pages listed below, or by using the keyword search tool below to find specific information within the annual report.-
 1
1 -
2
-
3
-
4
-
5
-
6
-
7
-
8
-
9
-
10
-
11
-
12
-
13
-
14
-
15
-
16
-
17
-
18
-
19
-
20
-
21
-
22
-
23
-
24
-
25
-
26
-
27
-
28
-
29
-
30
-
31
-
32
-
33
-
34
-
35
-
36
-
37
-
38
-
39
-
40
-
41
-
42
-
43
-
44
-
45
-
46
-
47
-
48
-
49
-
50
-
51
-
52
-
53
-
54
-
55
-
56
-
57
-
58
-
59
-
 60
60 -
 61
61 -
 62
62 -
 63
63 -
 64
64 -
 65
65 -
 66
66 -
 67
67 -
 68
68 -
 69
69 -
 70
70 -
 71
71 -
 72
72 -
 73
73 -
 74
74 -
 75
75 -
 76
76 -
 77
77 -
 78
78 -
 79
79 -
 80
80 -
81
-
82
-
83
-
84
-
85
-
86
-
87
-
88
-
89
-
90
-
91
-
92
-
93
-
94
-
95
-
96
-
97
-
98
-
99
-
100
-
101
-
102
-
103
-
104
-
105
-
106
-
107
-
108
-
109
-
110
-
111
-
112
-
113
-
114
-
115
-
116
-
117
-
118
-
119
-
120
-
121
-
122
-
123
-
124
-
125
-
126
-
127
-
128
-
129
-
130
-
131
-
132
-
133
-
134
-
135
-
136
-
137
-
138
-
139
-
140
-
141
-
142
-
143
-
144
-
145
-
146
-
147
-
148
-
149
-
150
-
151
-
152
-
153
-
154
-
155
-
156
-
157
-
158
-
159
-
160
-
161
-
162
-
163
-
164
-
165
-
166
-
167
-
168
-
169
-
170
-
171
-
172
-
173
-
174
-
175
-
176
-
177
-
178
-
179
-
180
-
181
-
182
-
183
-
184
-
185
-
186
-
187
-
188
-
189
-
190
-
191
-
192
-
193
-
194
-
195
-
196
-
197
-
198
-
199
-
200
-
201
-
202
-
203
-
204
-
205
-
206
-
207
-
208
-
209
-
210
-
211
-
212
-
213
-
214
-
215
-
216
-
217
-
218
-
219
-
220
-
221
-
222
-
223
-
224
-
225
-
226
-
227
-
228
-
229
-
230
-
231
-
232
-
233
-
234
-
235
-
236
-
237
-
238
-
239
-
240
-
241
 |
 |

Table of Contents
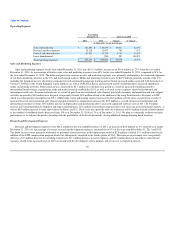
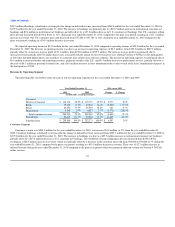
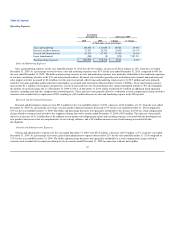
Operating Expenses
Year Ended
December 31, 2010 versus 2009
2010 2009 Change % Change
(in thousands, except percentages)
Sales and marketing 130,879 $ 114,899 $ 15,980 13.9%
Research and development 23,437 26,239 (2,802) (10.7)%
General and administrative 53,239 57,182 (3,943) (6.9)%
Lease abandonment (583) (8) (575) 7187.5%
Total operating expenses $ 206,972 $ 198,312 $ 8,660 4.4%
Sales and Marketing Expenses
Sales and marketing expenses for the year ended December 31, 2010 were $130.9 million, an increase of $16.0 million, or 14%, from the year ended
December 31, 2009. As a percentage of total revenue, sales and marketing expenses were 51% for the year ended December 31, 2010, compared to 46% for
the year ended December 31, 2009. The dollar and percentage increase in sales and marketing expenses were primarily attributable to the continued expansion
of our direct marketing activities in the U.S. and international markets. Personnel costs related to growth in our institutional sales channel and marketing and
sales support activities increased by $6.2 million over the prior year period. Advertising and marketing expenses grew by $5.9 million and were primarily
related to television and radio media and retail visual displays associated with our launch of Rosetta Stone Version 4 TOTALe. Travel and training expense
increased by $1.1 million over the prior year period as a result of increased travel in our institutional sales channel and global initiatives. We also expanded
the number of our kiosks from 242 as of December 31, 2009 to 259 as of December 31, 2010, which resulted in $3.3 million of additional kiosk operating
expenses, including rent and sales compensation related expenses. These increases were partially offset by a reduction in stock compensation charge related to
common stock awarded to key employees in 2009, resulting in a $0.4 million decrease in sales and marketing expense in the 2010 period.
Research and Development Expenses
Research and development expenses were $23.4 million for the year ended December 31 2010, a decrease of $2.8 million, or 11%, from the year ended
December 31, 2009. As a percentage of revenue, research and development expenses decreased to 9% for the year ended December 31, 2010 compared to
10% for the year ended December 31, 2009. The dollar and percentage decreases were primarily attributable to the absence in 2010 of a stock compensation
charge related to common stock awards to key employees during the twelve months ended December 31, 2009 of $5.0 million. This decrease was partially
offset by an increase of $1.3 million due to the addition of new product development personnel and consulting expense associated with the development of
new products and services that are complementary to our existing solutions, and a $0.4 million increase in travel and training associated with this
development.
General and Administrative Expenses
General and administrative expenses for the year ended December 31, 2010 were $53.2 million, a decrease of $3.9 million, or 7%, from the year ended
December 31, 2009. As a percentage of revenue, general and administrative expenses decreased to 21% for the year ended December 31, 2010 compared to
23% for the year ended December 31, 2009. The dollar and percentage decreases were primarily attributable to a stock compensation charge related to
common stock awarded to key employees during the twelve months ended December 31, 2009 in connection with our initial public
67