Rosetta Stone 2011 Annual Report Download - page 108
Download and view the complete annual report
Please find page 108 of the 2011 Rosetta Stone annual report below. You can navigate through the pages in the report by either clicking on the pages listed below, or by using the keyword search tool below to find specific information within the annual report.-
 1
1 -
2
-
3
-
4
-
5
-
6
-
7
-
8
-
9
-
10
-
11
-
12
-
13
-
14
-
15
-
16
-
17
-
18
-
19
-
20
-
21
-
22
-
23
-
24
-
25
-
26
-
27
-
28
-
29
-
30
-
31
-
32
-
33
-
34
-
35
-
36
-
37
-
38
-
39
-
40
-
41
-
42
-
43
-
44
-
45
-
46
-
47
-
48
-
49
-
50
-
51
-
52
-
53
-
54
-
55
-
56
-
57
-
58
-
59
-
60
-
61
-
62
-
63
-
64
-
65
-
66
-
67
-
68
-
69
-
70
-
71
-
72
-
73
-
74
-
75
-
76
-
77
-
78
-
79
-
80
-
81
-
82
-
83
-
84
-
85
-
86
-
87
-
88
-
89
-
90
-
91
-
92
-
93
-
94
-
95
-
96
-
97
-
 98
98 -
 99
99 -
 100
100 -
 101
101 -
 102
102 -
 103
103 -
 104
104 -
 105
105 -
 106
106 -
 107
107 -
 108
108 -
 109
109 -
 110
110 -
 111
111 -
 112
112 -
 113
113 -
 114
114 -
 115
115 -
 116
116 -
 117
117 -
 118
118 -
119
-
120
-
121
-
122
-
123
-
124
-
125
-
126
-
127
-
128
-
129
-
130
-
131
-
132
-
133
-
134
-
135
-
136
-
137
-
138
-
139
-
140
-
141
-
142
-
143
-
144
-
145
-
146
-
147
-
148
-
149
-
150
-
151
-
152
-
153
-
154
-
155
-
156
-
157
-
158
-
159
-
160
-
161
-
162
-
163
-
164
-
165
-
166
-
167
-
168
-
169
-
170
-
171
-
172
-
173
-
174
-
175
-
176
-
177
-
178
-
179
-
180
-
181
-
182
-
183
-
184
-
185
-
186
-
187
-
188
-
189
-
190
-
191
-
192
-
193
-
194
-
195
-
196
-
197
-
198
-
199
-
200
-
201
-
202
-
203
-
204
-
205
-
206
-
207
-
208
-
209
-
210
-
211
-
212
-
213
-
214
-
215
-
216
-
217
-
218
-
219
-
220
-
221
-
222
-
223
-
224
-
225
-
226
-
227
-
228
-
229
-
230
-
231
-
232
-
233
-
234
-
235
-
236
-
237
-
238
-
239
-
240
-
241
 |
 |

Table of Contents
ROSETTA STONE INC.
NOTES TO CONSOLIDATED FINANCIAL STATEMENTS (Continued)
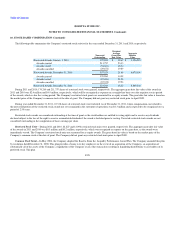
10. STOCK-BASED COMPENSATION (Continued)
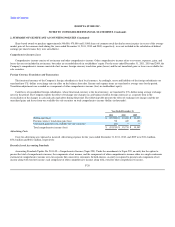
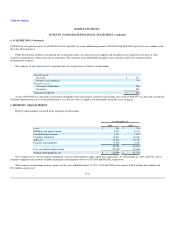
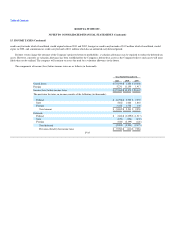
Stock Options—The following table summarizes the Company's stock option activity from January 1, 2011 to December 31, 2011:
Options
Outstanding
Weighted
Average
Exercise
Price
Weighted
Average
Contractual
Life (years)
Aggregate
Intrinsic
Value
Options Outstanding, January 1, 2011 2,020,927 $ 13.25 $ 7.36 $ 17,733,080
Options granted 698,327 13.37
Options exercised (181,843) 4.37
Options cancelled (313,662) 18.36
Options Outstanding, December 31, 2011 2,223,749 13.29 7.14 2,288,131
Vested and expected to vest at December 31, 2011 2,052,059 13.05 6.99 2,282,767
Exercisable at December 31, 2011 1,167,404 9.92 5.75 2,263,592
As of December 31, 2011 and 2010, there was approximately $8.2 million and $8.3 million of unrecognized stock-based compensation expense related to
non-vested stock option awards that is expected to be recognized over a weighted average period of 2.75 and 2.76 years, respectively.
Stock options are granted at the discretion of the Board of Directors or the Compensation Committee (or its authorized member(s)) and expire 10 years
from the date of the grant. Options generally vest over a four-year period based upon required service conditions. No options have performance or market
conditions. The Company calculates the pool of additional paid-in capital associated with excess tax benefits using the "simplified method" in accordance
with ASC 718.
The weighted average remaining contractual term and the aggregate intrinsic value for options outstanding at December 31, 2011 was 7.14 years and
$2.3 million, respectively. The weighted average remaining contractual term and the aggregate intrinsic value for options exercisable at December 31, 2010
was 7.36 years and $17.7 million, respectively. As of December 31, 2011, options that were vested and exercisable totaled 1,167,404 shares of common stock
with a weighted average exercise price per share of $9.92.
The weighted average grant-date fair value per share of stock options granted was $7.35, $13.60 and $10.32 for the years ended December 31, 2011,
2010 and 2009, respectively.
The aggregate intrinsic value disclosed above represents the total intrinsic value (the difference between the fair market value of the Company's common
stock as of December 31, 2011, and the exercise price, multiplied by the number of in-the-money options) that would have been received by the option
holders had all option holders exercised their options on December 31, 2011. This amount is subject to change based on changes to the fair market value of
the Company's common stock.
F-27