Rosetta Stone 2011 Annual Report Download - page 71
Download and view the complete annual report
Please find page 71 of the 2011 Rosetta Stone annual report below. You can navigate through the pages in the report by either clicking on the pages listed below, or by using the keyword search tool below to find specific information within the annual report.-
 1
1 -
2
-
3
-
4
-
5
-
6
-
7
-
8
-
9
-
10
-
11
-
12
-
13
-
14
-
15
-
16
-
17
-
18
-
19
-
20
-
21
-
22
-
23
-
24
-
25
-
26
-
27
-
28
-
29
-
30
-
31
-
32
-
33
-
34
-
35
-
36
-
37
-
38
-
39
-
40
-
41
-
42
-
43
-
44
-
45
-
46
-
47
-
48
-
49
-
50
-
51
-
52
-
53
-
54
-
55
-
56
-
57
-
58
-
59
-
60
-
 61
61 -
 62
62 -
 63
63 -
 64
64 -
 65
65 -
 66
66 -
 67
67 -
 68
68 -
 69
69 -
 70
70 -
 71
71 -
 72
72 -
 73
73 -
 74
74 -
 75
75 -
 76
76 -
 77
77 -
 78
78 -
 79
79 -
 80
80 -
 81
81 -
82
-
83
-
84
-
85
-
86
-
87
-
88
-
89
-
90
-
91
-
92
-
93
-
94
-
95
-
96
-
97
-
98
-
99
-
100
-
101
-
102
-
103
-
104
-
105
-
106
-
107
-
108
-
109
-
110
-
111
-
112
-
113
-
114
-
115
-
116
-
117
-
118
-
119
-
120
-
121
-
122
-
123
-
124
-
125
-
126
-
127
-
128
-
129
-
130
-
131
-
132
-
133
-
134
-
135
-
136
-
137
-
138
-
139
-
140
-
141
-
142
-
143
-
144
-
145
-
146
-
147
-
148
-
149
-
150
-
151
-
152
-
153
-
154
-
155
-
156
-
157
-
158
-
159
-
160
-
161
-
162
-
163
-
164
-
165
-
166
-
167
-
168
-
169
-
170
-
171
-
172
-
173
-
174
-
175
-
176
-
177
-
178
-
179
-
180
-
181
-
182
-
183
-
184
-
185
-
186
-
187
-
188
-
189
-
190
-
191
-
192
-
193
-
194
-
195
-
196
-
197
-
198
-
199
-
200
-
201
-
202
-
203
-
204
-
205
-
206
-
207
-
208
-
209
-
210
-
211
-
212
-
213
-
214
-
215
-
216
-
217
-
218
-
219
-
220
-
221
-
222
-
223
-
224
-
225
-
226
-
227
-
228
-
229
-
230
-
231
-
232
-
233
-
234
-
235
-
236
-
237
-
238
-
239
-
240
-
241
 |
 |

Table of Contents
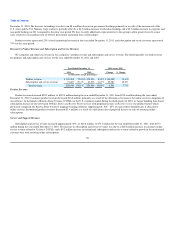
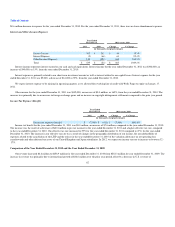
offering of $13.4 million. This decrease was partially offset by a $5.3 million increase in legal fees primarily attributable to our trademark infringement
lawsuit against Google, Inc. and other intellectual property enforcement actions. In addition, personnel related costs increased $1.1 million due to expansion
of our finance, legal, human resources, information technology and other administrative functions which provide continued support of our overall growth and
international expansion. Consulting expense increased $1.0 million primarily the result of increased expenses associated with investment in our IT
infrastructure. Liability insurances for directors and officers increased $0.3 million, business taxes increased by $0.2 million and audit fees increased
$0.4 million. Bad debt expense increased $0.8 million primarily due to an additional reserve to limit our financial exposure related to the Chapter 11
bankruptcy reorganization of Borders Group, Inc.
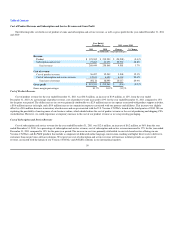
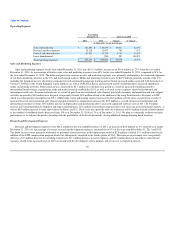
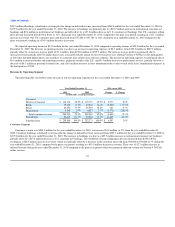
Stock-Based Compensation
Included in each of the respective operating expense lines for the year ended December 31, 2009 is a portion of the $18.8 million charge related to the
total of 591,491 shares of common stock awarded to 10 of our key employees in April 2009. The following table presents the stock-based compensation
charge by operating expense line item:
Year Ended December 31,
2010 2009 Change % Change
(dollars in thousands)
Sales and marketing 774 $ 377 $ 397 105%
Research and development 1,181 5,033 (3,852) (77)%
General and administrative 2,393 13,393 (11,000) (82)%
Total $ 4,348 $ 18,803 $ (14,455) (77)%
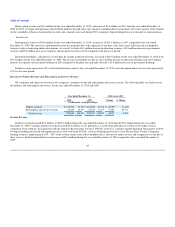
Lease Abandonment Expenses
As a result of accelerated growth in our Arlington, Virginia headquarters, the Company exceeded maximum capacity in our leased office space in the
third quarter of 2010. At that time, there was no additional space available for lease in the 1919 N. Lynn St. location and additional space was needed to
support continued growth. Our previously abandoned office space at 1101 Wilson Blvd was unoccupied, and as a result of its close proximity to the 1919 N.
Lynn St. location, we made the decision to reoccupy the formerly abandoned space. As of September 30, 2010, the remaining liability associated with the
abandonment of the operating lease at 1101 Wilson Blvd was reversed resulting in a $0.6 million decrease in expense for the year ended December 31, 2010
compared to December 31, 2009.
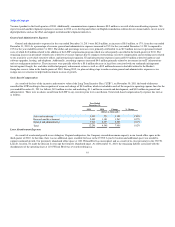
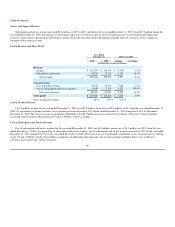
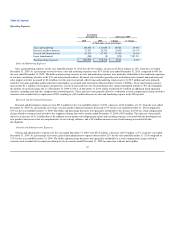
Interest and Other Income (Expense)
Year Ended December 31, 2010 versus 2009
2010 2009 Change % Change
(in thousands, except percentages)
Interest Income 262 $ 159 $ 103 64.8%
Interest Expense (66) (356) 290 (81.5)%
Other Income (Expense) (220) 112 (332) (296.4)%
Total other income/(expense) $ (24) $ (85) $ 61 71.8%
Interest income represents interest earned on our cash and cash equivalents. Interest income for the year ended December 31, 2010 was $0.3 million, an
increase of $0.1 million, or 65%, from the year ended December 31, 2009.
68