Rosetta Stone 2011 Annual Report Download - page 66
Download and view the complete annual report
Please find page 66 of the 2011 Rosetta Stone annual report below. You can navigate through the pages in the report by either clicking on the pages listed below, or by using the keyword search tool below to find specific information within the annual report.-
 1
1 -
2
-
3
-
4
-
5
-
6
-
7
-
8
-
9
-
10
-
11
-
12
-
13
-
14
-
15
-
16
-
17
-
18
-
19
-
20
-
21
-
22
-
23
-
24
-
25
-
26
-
27
-
28
-
29
-
30
-
31
-
32
-
33
-
34
-
35
-
36
-
37
-
38
-
39
-
40
-
41
-
42
-
43
-
44
-
45
-
46
-
47
-
48
-
49
-
50
-
51
-
52
-
53
-
54
-
55
-
 56
56 -
 57
57 -
 58
58 -
 59
59 -
 60
60 -
 61
61 -
 62
62 -
 63
63 -
 64
64 -
 65
65 -
 66
66 -
 67
67 -
 68
68 -
 69
69 -
 70
70 -
 71
71 -
 72
72 -
 73
73 -
 74
74 -
 75
75 -
 76
76 -
77
-
78
-
79
-
80
-
81
-
82
-
83
-
84
-
85
-
86
-
87
-
88
-
89
-
90
-
91
-
92
-
93
-
94
-
95
-
96
-
97
-
98
-
99
-
100
-
101
-
102
-
103
-
104
-
105
-
106
-
107
-
108
-
109
-
110
-
111
-
112
-
113
-
114
-
115
-
116
-
117
-
118
-
119
-
120
-
121
-
122
-
123
-
124
-
125
-
126
-
127
-
128
-
129
-
130
-
131
-
132
-
133
-
134
-
135
-
136
-
137
-
138
-
139
-
140
-
141
-
142
-
143
-
144
-
145
-
146
-
147
-
148
-
149
-
150
-
151
-
152
-
153
-
154
-
155
-
156
-
157
-
158
-
159
-
160
-
161
-
162
-
163
-
164
-
165
-
166
-
167
-
168
-
169
-
170
-
171
-
172
-
173
-
174
-
175
-
176
-
177
-
178
-
179
-
180
-
181
-
182
-
183
-
184
-
185
-
186
-
187
-
188
-
189
-
190
-
191
-
192
-
193
-
194
-
195
-
196
-
197
-
198
-
199
-
200
-
201
-
202
-
203
-
204
-
205
-
206
-
207
-
208
-
209
-
210
-
211
-
212
-
213
-
214
-
215
-
216
-
217
-
218
-
219
-
220
-
221
-
222
-
223
-
224
-
225
-
226
-
227
-
228
-
229
-
230
-
231
-
232
-
233
-
234
-
235
-
236
-
237
-
238
-
239
-
240
-
241
 |
 |

Table of Contents
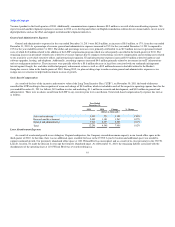
$20.2 million. Bookings, calculated as revenue plus the change in deferred revenue, increased from $262.6 million for the year ended December 31, 2009 to
$279.9 million for the year ended December 31, 2010. The increase in bookings was primarily due to a $25.7 million increase in international consumer net
bookings and $9.4 million in institutional net bookings, partially offset by a $17.8 million decrease in U.S. consumer net bookings. The U.S. consumer selling
price per unit increased from $344 to $381, or 11%, during the year ended December 31, 2010, compared to the prior year period, resulting in a $17.1 million
increase in revenue. Our U.S. consumer units sold decreased from 557,200 to 455,700, or 18%, during the year ended December 31, 2010 compared to the
prior year period, resulting in a $34.9 million decrease in revenue.
We reported operating income of $12.9 million for the year ended December 31, 2010 compared to operating income of $20.5 million for the year ended
December 31, 2009. The decrease in operating income was due to an increase in operating expenses of $8.7 million, from $198.3 million to $207.0 million,
partially offset by an increase in gross profit of $1.1 million, from $218.8 million to $219.9 million. The increase in gross profit was primarily due to
increased revenue partially offset by higher direct costs associated with the launch of our web-based services offering Version 4 TOTALe in the third quarter
of 2010 that included higher direct costs to deliver to customers than our previous software solutions. The increase in operating expenses was primarily due to
$6.0 million in increased media and marketing activities, primarily outside of the U.S., and $9.4 million increase in professional services, partially offset by a
decrease of $6.1 million in personnel-related costs, and a $0.6 million decrease in lease abandonment due to the reversal of the lease abandonment expenses in
the third quarter of 2010.
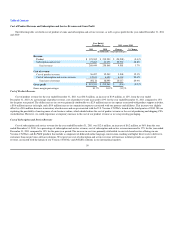
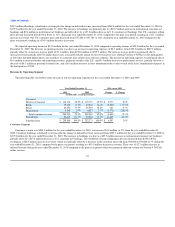
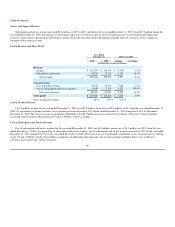
Revenue by Operating Segment
The following table sets forth revenue for each of our two operating segments for the years ended December 31, 2010 and 2009:
Year Ended December 31,
2010 versus 2009
2010
2009
Change % Change
(in thousands, except percentages)
Consumer:
Direct-to-Consumer $ 118,164 45.6% $ 115,791 45.9% $ 2,373 2.0%
Kiosk 35,000 13.5% 40,565 16.1% (5,565) (13.7)%
Retail 46,054 17.8% 45,894 18.2% 160 0.3%
Homeschool 5,045 1.9% 6,817 2.7% (1,772) (26.0)%
Total consumer revenue 204,263 78.9% 209,067 82.9% (4,804) (2.3)%
Institutional 54,605 21.1% 43,204 17.1% 11,401 26.4%
Total Revenue $ 258,868 100.0% $ 252,271 100.0% $ 6,597 2.6%
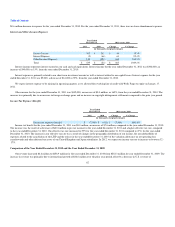
Consumer Segment
Consumer revenue was $204.3 million for the year ended December 31, 2010, a decrease of $4.8 million, or 2%, from the year ended December 31,
2009. Consumer bookings, calculated as revenue plus the change in deferred revenue, increased from $209.1 million for the year ended December 31, 2009 to
$217.0 million for the year ended December 31, 2010. The increase in bookings was due to a $25.7 million increase in international consumer net bookings,
partially offset by a $17.8 million decrease in U.S. consumer net bookings. The worldwide average selling price per unit increased from $350 to $392,
resulting in a $22.9 million increase in revenue, which was partially offset by a decrease in the consumer units sold from 596,800 to 553,800 or 7% during the
year ended December 31, 2010, compared to the prior year period, resulting in a $15.0 million decrease in revenue. There was a $12.7 million increase in
deferred revenue during the year ended December 31, 2010 compared to the prior year period, which was primarily deferred revenue for Version 4 TOTALe
online services.
63