Rosetta Stone 2011 Annual Report Download - page 68
Download and view the complete annual report
Please find page 68 of the 2011 Rosetta Stone annual report below. You can navigate through the pages in the report by either clicking on the pages listed below, or by using the keyword search tool below to find specific information within the annual report.-
 1
1 -
2
-
3
-
4
-
5
-
6
-
7
-
8
-
9
-
10
-
11
-
12
-
13
-
14
-
15
-
16
-
17
-
18
-
19
-
20
-
21
-
22
-
23
-
24
-
25
-
26
-
27
-
28
-
29
-
30
-
31
-
32
-
33
-
34
-
35
-
36
-
37
-
38
-
39
-
40
-
41
-
42
-
43
-
44
-
45
-
46
-
47
-
48
-
49
-
50
-
51
-
52
-
53
-
54
-
55
-
56
-
57
-
 58
58 -
 59
59 -
 60
60 -
 61
61 -
 62
62 -
 63
63 -
 64
64 -
 65
65 -
 66
66 -
 67
67 -
 68
68 -
 69
69 -
 70
70 -
 71
71 -
 72
72 -
 73
73 -
 74
74 -
 75
75 -
 76
76 -
 77
77 -
 78
78 -
79
-
80
-
81
-
82
-
83
-
84
-
85
-
86
-
87
-
88
-
89
-
90
-
91
-
92
-
93
-
94
-
95
-
96
-
97
-
98
-
99
-
100
-
101
-
102
-
103
-
104
-
105
-
106
-
107
-
108
-
109
-
110
-
111
-
112
-
113
-
114
-
115
-
116
-
117
-
118
-
119
-
120
-
121
-
122
-
123
-
124
-
125
-
126
-
127
-
128
-
129
-
130
-
131
-
132
-
133
-
134
-
135
-
136
-
137
-
138
-
139
-
140
-
141
-
142
-
143
-
144
-
145
-
146
-
147
-
148
-
149
-
150
-
151
-
152
-
153
-
154
-
155
-
156
-
157
-
158
-
159
-
160
-
161
-
162
-
163
-
164
-
165
-
166
-
167
-
168
-
169
-
170
-
171
-
172
-
173
-
174
-
175
-
176
-
177
-
178
-
179
-
180
-
181
-
182
-
183
-
184
-
185
-
186
-
187
-
188
-
189
-
190
-
191
-
192
-
193
-
194
-
195
-
196
-
197
-
198
-
199
-
200
-
201
-
202
-
203
-
204
-
205
-
206
-
207
-
208
-
209
-
210
-
211
-
212
-
213
-
214
-
215
-
216
-
217
-
218
-
219
-
220
-
221
-
222
-
223
-
224
-
225
-
226
-
227
-
228
-
229
-
230
-
231
-
232
-
233
-
234
-
235
-
236
-
237
-
238
-
239
-
240
-
241
 |
 |

Table of Contents
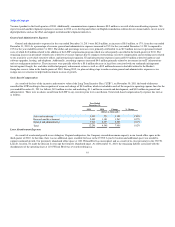
Home school revenue was $5.0 million for the year ended December 31, 2010, a decrease of $1.8 million, or 26%, from the year ended December 31,
2009. In 2009, we began offering home school edition products through other sales channels, including direct-to-consumer call centers and our retail channels.
As the availability of home school products in other sales channels increased during 2010, consumers began utilizing these new channels to make purchases.
Institutional
Institutional revenue was $54.6 million for the year ended December 31, 2010, an increase of $11.4 million, or 26%, compared to the year ended
December 31, 2009. The increase in institutional revenue was primarily due to the expansion of our direct sales force and a shift from sales of perpetual
licenses to sales of renewing online subscriptions. As a result, we had a $4.3 million increase in education revenue, a $1.3 million increase in government
revenue, and $5.8 million increase in corporate and non-profit revenue in 2010 compared to the prior year period.
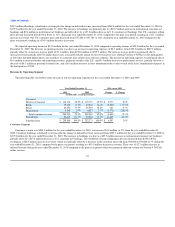
Institutional bookings, calculated as revenue plus the change in deferred revenue, increased to $62.9 million for the year ended December 31, 2010 from
$53.5 million for the year ended December 31, 2009. The increase in bookings was due to a $6.0 million increase in education bookings and a $4.8 million
increase in corporate and non-profit bookings in 2010 compared to the prior year, partially offset by a $1.4 million decrease in government bookings.
Product revenue represented 33% of total institutional revenue for the year ended December 31, 2010, and subscription and service revenue represented
67% for the same period.
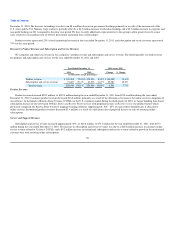
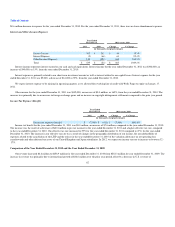
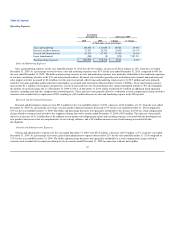
Revenue by Product Revenue and Subscription and Service Revenue
We categorize and report our revenue in two categories—product revenue and subscription and service revenue. The following table sets forth revenue
for products and subscription and services for the year ended December 31, 2010 and 2009:
Year Ended December 31,
2010 versus 2009
2010
2009
Change % Change
(in thousands, except percentages)
Product revenue $ 215,590 83.3% $ 218,549 86.6% $ (2,959) (1.4)%
Subscription and service revenue 43,278 16.7% 33,722 13.4% 9,556 28.3%
Total revenue 258,868 100.0% 252,271 100.0% 6,597 2.6%
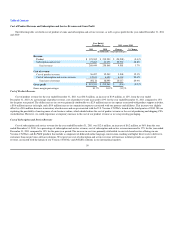
Product Revenue
Product revenue decreased $3.0 million, to $215.6 million during the year ended December 31, 2010 from $218.5 million during the year ended
December 31, 2009. Consumer product revenue decreased $3.4 million, or 2%, primarily as a result of the allocation of revenue to the online services
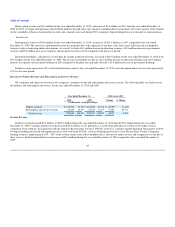
component of our software. In conjunction with the launch of Rosetta Stone Version 4 TOTALe in the U.S. consumer market during the third quarter of 2010,
we began bundling time-based subscription licenses of our web-based TOTALe services with perpetual licenses of our Rosetta Stone Version 3 language-
learning solutions. Approximately 10% - 25% of the revenues from each of these bundled sales is allocated to online services and recognized over the life of
these services. Institutional product revenues increased $0.4 million during the year ended December 31, 2010 compared to the year ended December 31,
2009.
65