Rosetta Stone 2011 Annual Report Download - page 73
Download and view the complete annual report
Please find page 73 of the 2011 Rosetta Stone annual report below. You can navigate through the pages in the report by either clicking on the pages listed below, or by using the keyword search tool below to find specific information within the annual report.-
 1
1 -
2
-
3
-
4
-
5
-
6
-
7
-
8
-
9
-
10
-
11
-
12
-
13
-
14
-
15
-
16
-
17
-
18
-
19
-
20
-
21
-
22
-
23
-
24
-
25
-
26
-
27
-
28
-
29
-
30
-
31
-
32
-
33
-
34
-
35
-
36
-
37
-
38
-
39
-
40
-
41
-
42
-
43
-
44
-
45
-
46
-
47
-
48
-
49
-
50
-
51
-
52
-
53
-
54
-
55
-
56
-
57
-
58
-
59
-
60
-
61
-
62
-
 63
63 -
 64
64 -
 65
65 -
 66
66 -
 67
67 -
 68
68 -
 69
69 -
 70
70 -
 71
71 -
 72
72 -
 73
73 -
 74
74 -
 75
75 -
 76
76 -
 77
77 -
 78
78 -
 79
79 -
 80
80 -
 81
81 -
 82
82 -
 83
83 -
84
-
85
-
86
-
87
-
88
-
89
-
90
-
91
-
92
-
93
-
94
-
95
-
96
-
97
-
98
-
99
-
100
-
101
-
102
-
103
-
104
-
105
-
106
-
107
-
108
-
109
-
110
-
111
-
112
-
113
-
114
-
115
-
116
-
117
-
118
-
119
-
120
-
121
-
122
-
123
-
124
-
125
-
126
-
127
-
128
-
129
-
130
-
131
-
132
-
133
-
134
-
135
-
136
-
137
-
138
-
139
-
140
-
141
-
142
-
143
-
144
-
145
-
146
-
147
-
148
-
149
-
150
-
151
-
152
-
153
-
154
-
155
-
156
-
157
-
158
-
159
-
160
-
161
-
162
-
163
-
164
-
165
-
166
-
167
-
168
-
169
-
170
-
171
-
172
-
173
-
174
-
175
-
176
-
177
-
178
-
179
-
180
-
181
-
182
-
183
-
184
-
185
-
186
-
187
-
188
-
189
-
190
-
191
-
192
-
193
-
194
-
195
-
196
-
197
-
198
-
199
-
200
-
201
-
202
-
203
-
204
-
205
-
206
-
207
-
208
-
209
-
210
-
211
-
212
-
213
-
214
-
215
-
216
-
217
-
218
-
219
-
220
-
221
-
222
-
223
-
224
-
225
-
226
-
227
-
228
-
229
-
230
-
231
-
232
-
233
-
234
-
235
-
236
-
237
-
238
-
239
-
240
-
241
 |
 |

Table of Contents
Cash Flow Analysis
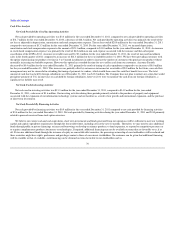
Net Cash Provided By (Used In) Operating Activities
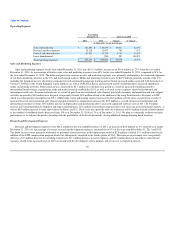
Net cash provided by operating activities was $3.4 million for the year ended December 31, 2011, compared to net cash provided by operating activities
of $31.7 million for the year ended December 31, 2010, a decrease of $28.3 million. Net cash provided by operating activities was primarily the result of the
net loss as adjusted for depreciation, amortization and stock compensation expense. The net loss totaled $20.0 million for the year ended December 31, 2011
compared to net income of $13.3 million for the year ended December 31, 2010. For the year ended December 31, 2011, we incurred depreciation,
amortization and stock compensation expense in the amount of $21.1 million, compared to $11.0 million for the year ended December 31, 2010. An increase
in stock-based compensation expense was primarily the result of $6.0 million in non cash expense associated with the issuance and then subsequent
cancellation of the LTIP in 2011. Accounts receivable increased by $5.1 million for the year ended December 31, 2011, the result of increased installment
sales in the fourth quarter of 2011 compared to an increase of $12.3 million for the year ended December 31, 2010. We have been providing customers with
the option of purchasing our product over time in 3 or 5 month installments in order to increase the number of customers who purchase our product without
materially increasing our bad debt exposure. However this option has extended the time for us to collect cash from our customers. Accounts Payable
decreased by $0.4 million for the year ended December 31, 2011 primarily the result of timing of cash expenditures compared to an increase of $6.0 million
for the year ended December 31, 2010. This increase was partially offset by an increase in income tax receivable of $5.8 million. In the future, our cash flow
management may not be successful in extending the timing of payments to vendors, which would then cause this cash flow benefit to reverse. The total
amount of cash that was held by foreign subsidiaries as of December 31, 2011 was $13.2 million. The Company does not plan to initiate any action that would
precipitate payment of U.S. income taxes on cash held by foreign subsidiaries, however if we were to repatriate the cash from our foreign subsidiaries, a
significant tax liability may result.
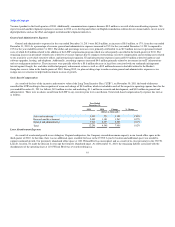
Net Cash Used In Investing Activities
Net cash used in investing activities was $13.3 million for the year ended December 31, 2011, compared to $14.9 million for the year ended
December 31, 2011, a decrease of $1.6 million. Our investing activities during these periods primarily related to the purchase of property and equipment
associated with the expansion of our information technology systems and our facilities as a result of our growth and international expansion, and the purchase
of short-term investments.
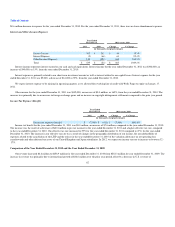
Net Cash Provided By Financing Activities
Net cash provided by financing activities was $0.9 million for the year ended December 31, 2011 compared to net cash provided by financing activities
of $3.4 million for the year ended December 31, 2010. Net cash provided by financing activities during the year ended December 31, 2011 and 2010 primarily
related to proceeds received from stock option exercises.
We believe our current cash and cash equivalents, short term investments and funds generated from our operations will be sufficient to meet our working
capital and capital expenditure requirements through the foreseeable future, including at least the next 12 months. Thereafter, we may need to raise additional
funds through public or private financings or increased borrowings to develop or enhance products, to fund expansion, to respond to competitive pressures or
to acquire complementary products, businesses or technologies. If required, additional financing may not be available on terms that are favorable to us, if at
all. If we raise additional funds through the issuance of equity or convertible debt securities, the percentage ownership of our stockholders will be reduced and
these securities might have rights, preferences and privileges senior to those of our current stockholders. No assurance can be given that additional financing
will be available or that, if available, such financing can be obtained on terms favorable to our stockholders and us.
70