Rosetta Stone 2011 Annual Report Download - page 57
Download and view the complete annual report
Please find page 57 of the 2011 Rosetta Stone annual report below. You can navigate through the pages in the report by either clicking on the pages listed below, or by using the keyword search tool below to find specific information within the annual report.-
 1
1 -
2
-
3
-
4
-
5
-
6
-
7
-
8
-
9
-
10
-
11
-
12
-
13
-
14
-
15
-
16
-
17
-
18
-
19
-
20
-
21
-
22
-
23
-
24
-
25
-
26
-
27
-
28
-
29
-
30
-
31
-
32
-
33
-
34
-
35
-
36
-
37
-
38
-
39
-
40
-
41
-
42
-
43
-
44
-
45
-
46
-
 47
47 -
 48
48 -
 49
49 -
 50
50 -
 51
51 -
 52
52 -
 53
53 -
 54
54 -
 55
55 -
 56
56 -
 57
57 -
 58
58 -
 59
59 -
 60
60 -
 61
61 -
 62
62 -
 63
63 -
 64
64 -
 65
65 -
 66
66 -
 67
67 -
68
-
69
-
70
-
71
-
72
-
73
-
74
-
75
-
76
-
77
-
78
-
79
-
80
-
81
-
82
-
83
-
84
-
85
-
86
-
87
-
88
-
89
-
90
-
91
-
92
-
93
-
94
-
95
-
96
-
97
-
98
-
99
-
100
-
101
-
102
-
103
-
104
-
105
-
106
-
107
-
108
-
109
-
110
-
111
-
112
-
113
-
114
-
115
-
116
-
117
-
118
-
119
-
120
-
121
-
122
-
123
-
124
-
125
-
126
-
127
-
128
-
129
-
130
-
131
-
132
-
133
-
134
-
135
-
136
-
137
-
138
-
139
-
140
-
141
-
142
-
143
-
144
-
145
-
146
-
147
-
148
-
149
-
150
-
151
-
152
-
153
-
154
-
155
-
156
-
157
-
158
-
159
-
160
-
161
-
162
-
163
-
164
-
165
-
166
-
167
-
168
-
169
-
170
-
171
-
172
-
173
-
174
-
175
-
176
-
177
-
178
-
179
-
180
-
181
-
182
-
183
-
184
-
185
-
186
-
187
-
188
-
189
-
190
-
191
-
192
-
193
-
194
-
195
-
196
-
197
-
198
-
199
-
200
-
201
-
202
-
203
-
204
-
205
-
206
-
207
-
208
-
209
-
210
-
211
-
212
-
213
-
214
-
215
-
216
-
217
-
218
-
219
-
220
-
221
-
222
-
223
-
224
-
225
-
226
-
227
-
228
-
229
-
230
-
231
-
232
-
233
-
234
-
235
-
236
-
237
-
238
-
239
-
240
-
241
 |
 |
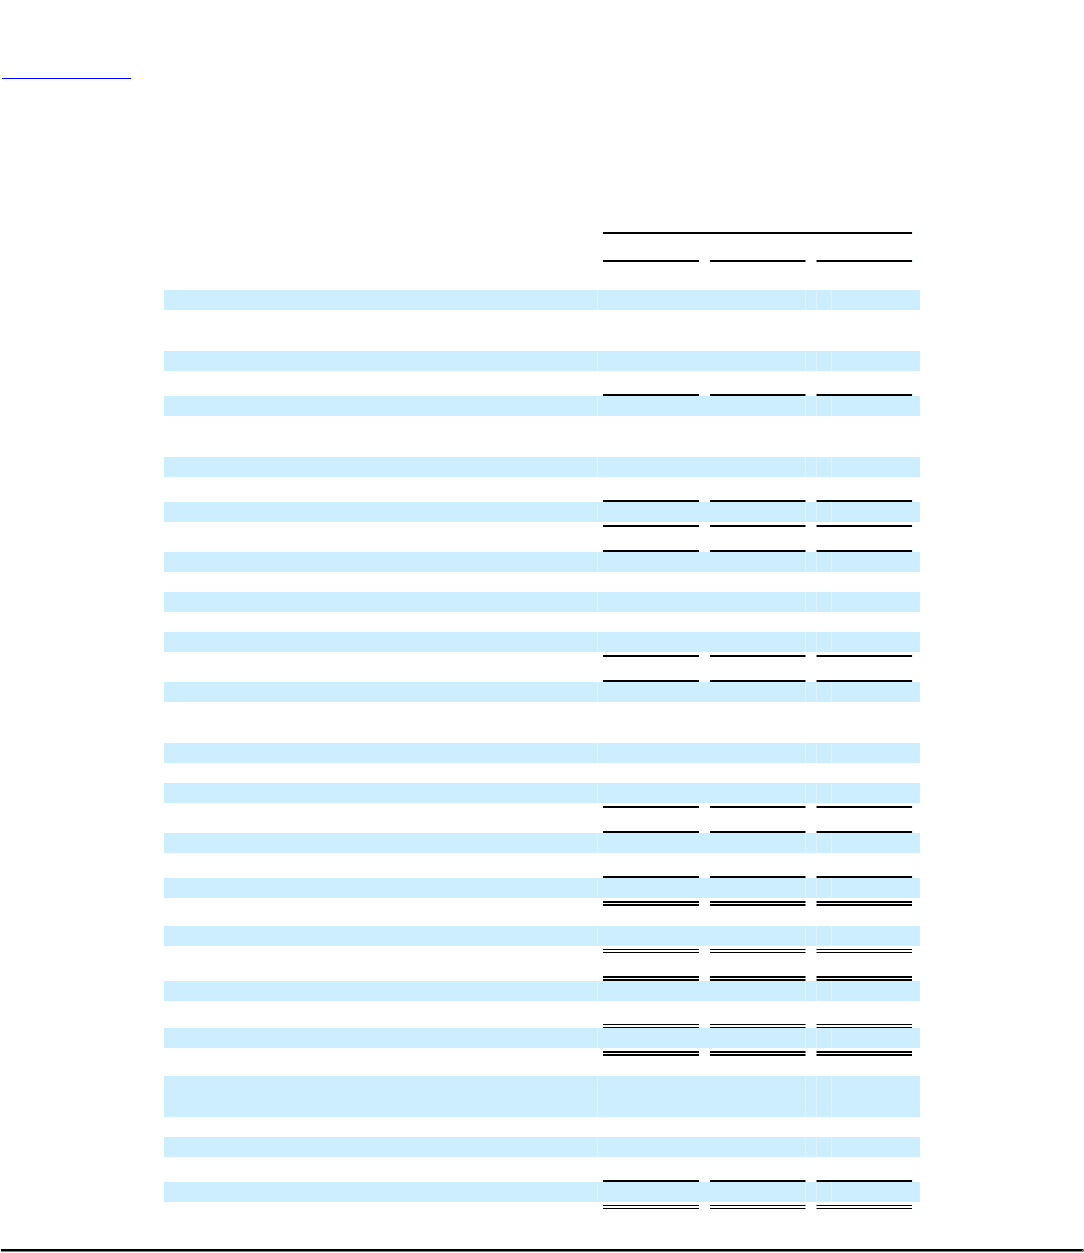
Table of Contents
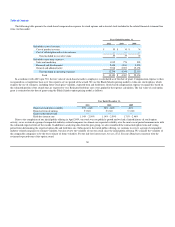
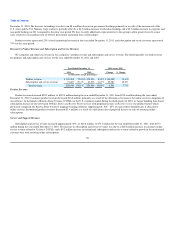
Results of Operations
The following table sets forth our consolidated statement of operations for the periods indicated.
Year Ended December 31,
2011 2010 2009
(in thousands, except per share data)
Statements of Operations Data:
Revenue
Product $ 195,382 $ 215,590 $ 218,549
Subscription and service 73,067 43,278 33,722
Total Revenue 268,449 258,868 252,271
Cost of revenue
Cost of product revenue 36,497 32,549 30,264
Cost of subscription and service revenue 12,619 6,450 3,163
Total cost of revenue 49,116 38,999 33,427
Gross profit 219,333 219,869 218,844
Operating expenses:
Sales and marketing 161,491 130,879 114,899
Research and development 24,218 23,437 26,239
General and administrative 62,031 53,239 57,182
Lease abandonment — (583) (8)
Total operating expenses 247,740 206,972 198,312
Income (loss) from operations (28,407) 12,897 20,532
Other income and expense:
Interest income 302 262 159
Interest expense (5) (66) (356)
Other (expense) income 142 (220) 112
Interest and other income (expense), net 439 (24) (85)
Income (loss) before income taxes (27,968) 12,873 20,447
Income tax expense (benefit) (7,980) (411) 7,084
Net income (loss) (19,988) 13,284 13,363
Income (loss) per share:
Basic $ (0.96) $ 0.65 $ 0.89
Diluted $ (0.96) $ 0.63 $ 0.67
Common shares and equivalents outstanding:
Basic weighted average shares 20,773 20,439 14,990
Diluted weighted average shares 20,773 21,187 19,930
Stock-based compensation included in:
Cost of sales $ 55 $ 39 $ 34
Sales and marketing 1,932 774 999
Research and development 2,448 1,181 5,959
General and administrative 7,918 2,393 15,158
$ 12,353 $ 4,387 $ 22,150
54