Rosetta Stone 2011 Annual Report Download - page 60
Download and view the complete annual report
Please find page 60 of the 2011 Rosetta Stone annual report below. You can navigate through the pages in the report by either clicking on the pages listed below, or by using the keyword search tool below to find specific information within the annual report.-
 1
1 -
2
-
3
-
4
-
5
-
6
-
7
-
8
-
9
-
10
-
11
-
12
-
13
-
14
-
15
-
16
-
17
-
18
-
19
-
20
-
21
-
22
-
23
-
24
-
25
-
26
-
27
-
28
-
29
-
30
-
31
-
32
-
33
-
34
-
35
-
36
-
37
-
38
-
39
-
40
-
41
-
42
-
43
-
44
-
45
-
46
-
47
-
48
-
49
-
 50
50 -
 51
51 -
 52
52 -
 53
53 -
 54
54 -
 55
55 -
 56
56 -
 57
57 -
 58
58 -
 59
59 -
 60
60 -
 61
61 -
 62
62 -
 63
63 -
 64
64 -
 65
65 -
 66
66 -
 67
67 -
 68
68 -
 69
69 -
 70
70 -
71
-
72
-
73
-
74
-
75
-
76
-
77
-
78
-
79
-
80
-
81
-
82
-
83
-
84
-
85
-
86
-
87
-
88
-
89
-
90
-
91
-
92
-
93
-
94
-
95
-
96
-
97
-
98
-
99
-
100
-
101
-
102
-
103
-
104
-
105
-
106
-
107
-
108
-
109
-
110
-
111
-
112
-
113
-
114
-
115
-
116
-
117
-
118
-
119
-
120
-
121
-
122
-
123
-
124
-
125
-
126
-
127
-
128
-
129
-
130
-
131
-
132
-
133
-
134
-
135
-
136
-
137
-
138
-
139
-
140
-
141
-
142
-
143
-
144
-
145
-
146
-
147
-
148
-
149
-
150
-
151
-
152
-
153
-
154
-
155
-
156
-
157
-
158
-
159
-
160
-
161
-
162
-
163
-
164
-
165
-
166
-
167
-
168
-
169
-
170
-
171
-
172
-
173
-
174
-
175
-
176
-
177
-
178
-
179
-
180
-
181
-
182
-
183
-
184
-
185
-
186
-
187
-
188
-
189
-
190
-
191
-
192
-
193
-
194
-
195
-
196
-
197
-
198
-
199
-
200
-
201
-
202
-
203
-
204
-
205
-
206
-
207
-
208
-
209
-
210
-
211
-
212
-
213
-
214
-
215
-
216
-
217
-
218
-
219
-
220
-
221
-
222
-
223
-
224
-
225
-
226
-
227
-
228
-
229
-
230
-
231
-
232
-
233
-
234
-
235
-
236
-
237
-
238
-
239
-
240
-
241
 |
 |

Table of Contents
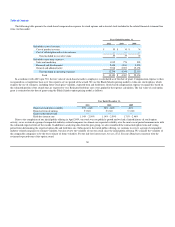
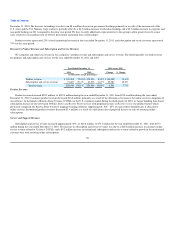
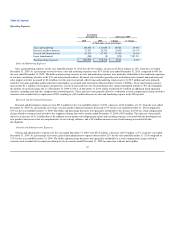
Retail
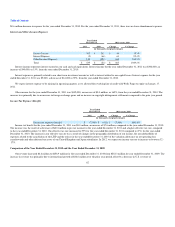
Retail revenue was $36.6 million for the year ended December 31, 2011, a decrease of $9.4 million or 20% from the year ended December 31, 2010. The
worldwide average selling price per unit decreased 36% during the year ended December 31, 2011 compared to the prior year period, resulting in a $20.9
million decrease in revenue, which was partially offset by an increase in units sold of 13% during the year ended December 31, 2011, resulting in a $6.6
million increase in revenue compared to the prior year period. The decrease in average selling price per unit was the result of the company decreasing prices
across all channels in the U.S. market. There was a $0.7 million increase in retail deferred revenue during the year ended December 31, 2011 compared to the
prior year period, which was primarily related to the launch of Version 4 TOTALe online services in our international markets.
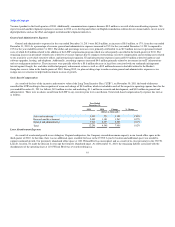
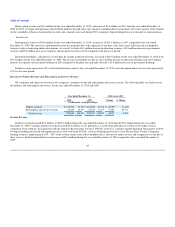
We are actively working to reduce our business and financial exposures by working with key partners on how we could modify the way we do business
together. We are considering, among other changes, changes to credit limits, payment terms, SKU reduction, store reduction or a change from terms to
consignment. Discussions are ongoing and the ultimate outcome is unknown. Any change in credit limits or payment terms would have no immediate impact,
however a change from terms to consignment could result in recording a charge in the period of the change and the issuance of a credit to the retailer for
existing inventory previously purchased on terms. Alternatively, a change from terms to consignment could result in a delay in the recognition of revenue on
future shipments until existing inventory has been exhausted and sell through materializes. Also, if the credit quality of a partner deteriorates, we may move to
delay the recording of bookings until we receive cash.
The majority of our sales in our Korean subsidiary are generated by sales on home shopping television networks. During the third and fourth quarter of
2011, sales of most educational products on home shopping networks were down, including our products. We are working on changes to our go to market
strategy, including changes in price and messaging to improve sales in this important channel.
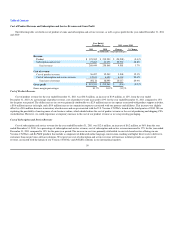
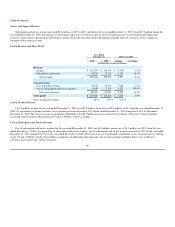
Home School
We reclassified our home school sales vertical from Institutional to Consumer. We believe the drivers of acquiring a home school customer are more
aligned with a typical sale in our consumer sales vertical. Prior year information has been modified to conform to current year presentation.
Home school revenue was $4.9 million for year ended December 31, 2011, a decrease of $0.2 million or 4% from the year ended December 31, 2010.
The average selling price per unit decreased 30% as a result of changes to the pricing of our products in the U.S. market during 2011, compared to the prior
year period, resulting in a $2.1 million decrease in revenue, which was offset by a 39% increase in units sold during 2011, compared to the prior year period,
resulting in a $2.0 million increase in revenue.
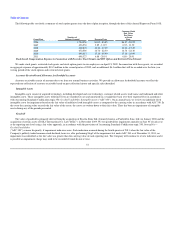
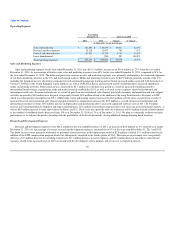
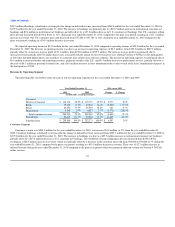
Institutional
Institutional revenue was $60.4 million for the year ended December 31, 2011, an increase of $5.8 million, or 11%, compared to the year ended
December 31, 2010. The increase in institutional revenue was primarily due to the expansion of our direct sales force and a shift from sales of perpetual
licenses to sales of renewing online subscriptions. As a result, we had a $5.8 million increase in education revenue and a $2.7 million increase in corporate
and non-profit revenue in 2011, compared to the prior year period. These increases were partially offset by a $2.7 million decrease in governmental revenues,
primarily as a result of government budget cuts including the non-renewal of the U.S. Army and U.S. Marines Corps contracts.
Institutional bookings, calculated as revenue plus the change in deferred revenue, decreased to $61.8 million for the year ended December 31, 2011 from
$62.9 million for the year ended
57