Rosetta Stone 2011 Annual Report Download - page 44
Download and view the complete annual report
Please find page 44 of the 2011 Rosetta Stone annual report below. You can navigate through the pages in the report by either clicking on the pages listed below, or by using the keyword search tool below to find specific information within the annual report.-
 1
1 -
2
-
3
-
4
-
5
-
6
-
7
-
8
-
9
-
10
-
11
-
12
-
13
-
14
-
15
-
16
-
17
-
18
-
19
-
20
-
21
-
22
-
23
-
24
-
25
-
26
-
27
-
28
-
29
-
30
-
31
-
32
-
33
-
 34
34 -
 35
35 -
 36
36 -
 37
37 -
 38
38 -
 39
39 -
 40
40 -
 41
41 -
 42
42 -
 43
43 -
 44
44 -
 45
45 -
 46
46 -
 47
47 -
 48
48 -
 49
49 -
 50
50 -
 51
51 -
 52
52 -
 53
53 -
 54
54 -
55
-
56
-
57
-
58
-
59
-
60
-
61
-
62
-
63
-
64
-
65
-
66
-
67
-
68
-
69
-
70
-
71
-
72
-
73
-
74
-
75
-
76
-
77
-
78
-
79
-
80
-
81
-
82
-
83
-
84
-
85
-
86
-
87
-
88
-
89
-
90
-
91
-
92
-
93
-
94
-
95
-
96
-
97
-
98
-
99
-
100
-
101
-
102
-
103
-
104
-
105
-
106
-
107
-
108
-
109
-
110
-
111
-
112
-
113
-
114
-
115
-
116
-
117
-
118
-
119
-
120
-
121
-
122
-
123
-
124
-
125
-
126
-
127
-
128
-
129
-
130
-
131
-
132
-
133
-
134
-
135
-
136
-
137
-
138
-
139
-
140
-
141
-
142
-
143
-
144
-
145
-
146
-
147
-
148
-
149
-
150
-
151
-
152
-
153
-
154
-
155
-
156
-
157
-
158
-
159
-
160
-
161
-
162
-
163
-
164
-
165
-
166
-
167
-
168
-
169
-
170
-
171
-
172
-
173
-
174
-
175
-
176
-
177
-
178
-
179
-
180
-
181
-
182
-
183
-
184
-
185
-
186
-
187
-
188
-
189
-
190
-
191
-
192
-
193
-
194
-
195
-
196
-
197
-
198
-
199
-
200
-
201
-
202
-
203
-
204
-
205
-
206
-
207
-
208
-
209
-
210
-
211
-
212
-
213
-
214
-
215
-
216
-
217
-
218
-
219
-
220
-
221
-
222
-
223
-
224
-
225
-
226
-
227
-
228
-
229
-
230
-
231
-
232
-
233
-
234
-
235
-
236
-
237
-
238
-
239
-
240
-
241
 |
 |
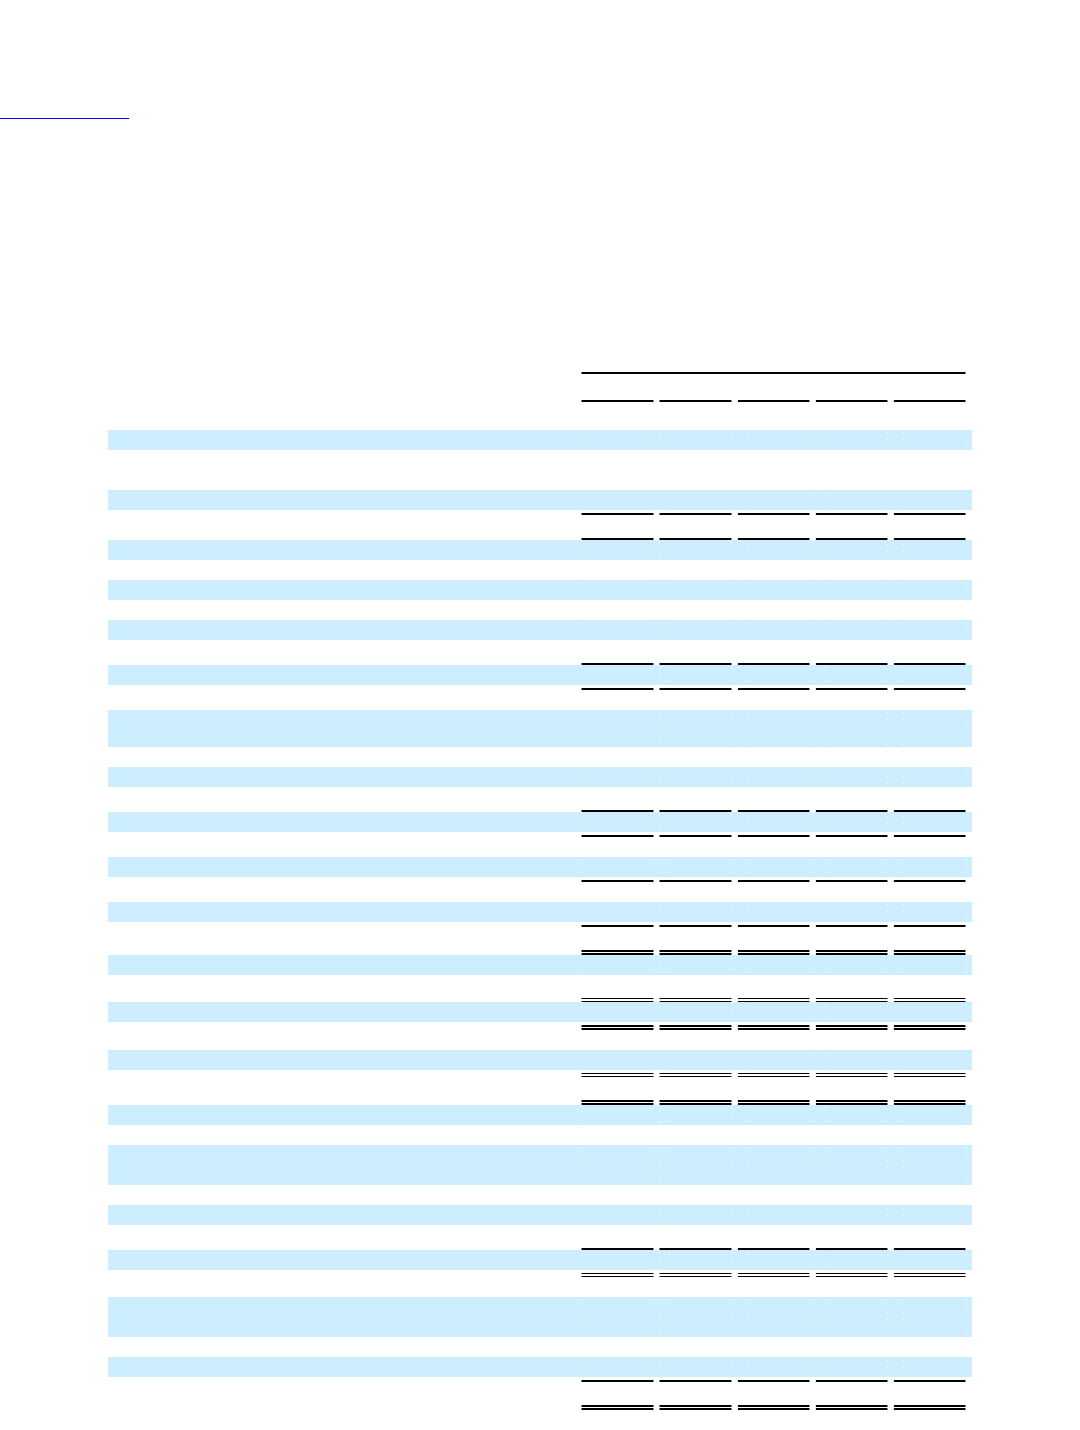
Table of Contents
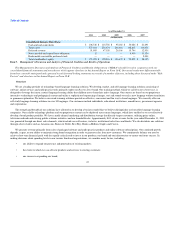
Item 6. Selected Consolidated Financial Data
The following table sets forth our selected consolidated statement of operations, balance sheet and other data for the periods indicated. The selected
consolidated statement of operations data for the years ended December 31, 2011, 2010, 2009, 2008 and 2007, and the consolidated balance sheet data as of
December 31, 2011, 2010, 2009, 2008 and 2007 have been derived from Rosetta Stone Inc. audited consolidated financial statements. This information should
be read in conjunction with "Management's Discussion and Analysis of Financial Condition and Results of Operations" and our consolidated financial
statements contained elsewhere in this Annual Report on Form 10-K. Our historical results for any prior period are not necessarily indicative of results to be
expected in any future period.
Year Ended December 31,
2011 2010 2009 2008 2007
(in thousands, except per share data)
Statements of Operations Data:
Revenue $ 268,449 $ 258,868 $ 252,271 $ 209,380 $ 137,321
Cost of revenue 49,116 38,999 33,427 28,676 20,687
Gross profit 219,333 219,869 218,844 180,704 116,634
Operating expenses:
Sales and marketing 161,491 130,879 114,899 93,384 65,437
Research and development 24,218 23,437 26,239 18,387 12,893
Acquired in-process research and development — — — —
General and administrative 62,031 53,239 57,182 39,577 29,786
Lease abandonment (583) (8) 1,831 —
Total operating expenses 247,740 206,972 198,312 153,179 108,116
Income (loss) from operations (28,407) 12,897 20,532 27,525 8,518
Other income and expense:
Interest income 302 262 159 454 673
Interest expense (5) (66) (356) (891) (1,331)
Other (expense) income 142 (220) 112 239 154
Interest and other income (expense), net 439 (24) (85) (198) (504)
Income (loss) before income taxes (27,968) 12,873 20,447 27,327 8,014
Income tax expense (benefit) (7,980) (411) 7,084 13,435 5,435
Net income (loss) (19,988) 13,284 13,363 13,892 2,579
Preferred stock accretion — — — — (80)
Income (loss) attributable to common stockholders $ (19,988)$ 13,284 $ 13,363 $ 13,892 $ 2,499
Income (loss) per share attributable to common stockholders:
Basic $ (0.96)$ 0.65 $ 0.89 $ 7.29 $ 1.47
Diluted $ (0.96)$ 0.63 $ 0.67 $ 0.82 $ 0.15
Common shares and equivalents outstanding:
Basic weighted average shares 20,773 20,439 14,990 1,905 1,702
Diluted weighted average shares 20,773 21,187 19,930 16,924 16,533
Other Data:
Stock-based compensation included in:
Cost of sales $ 55 $ 39 $ 34 $ 2 $ 2
Sales and marketing 1,932 774 999 153 189
Research and development 2,448 1,181 5,959 482 360
General and administrative 7,918 2,393 15,158 953 776
Total stock-based compensation expense $ 12,353 $ 4,387 $ 22,150 $ 1,590 $ 1,327
Intangible amortization included in:
Cost of sales $ — $ — $ — $ 13 $ 1,227
Sales and marketing 45 58 42 3,003 3,596
Research and development 40 — — — —
Total intangible amortization expense $ 85 $ 58 $ 42 $ 3,016 $ 4,823
42