Rosetta Stone 2011 Annual Report Download - page 87
Download and view the complete annual report
Please find page 87 of the 2011 Rosetta Stone annual report below. You can navigate through the pages in the report by either clicking on the pages listed below, or by using the keyword search tool below to find specific information within the annual report.-
 1
1 -
2
-
3
-
4
-
5
-
6
-
7
-
8
-
9
-
10
-
11
-
12
-
13
-
14
-
15
-
16
-
17
-
18
-
19
-
20
-
21
-
22
-
23
-
24
-
25
-
26
-
27
-
28
-
29
-
30
-
31
-
32
-
33
-
34
-
35
-
36
-
37
-
38
-
39
-
40
-
41
-
42
-
43
-
44
-
45
-
46
-
47
-
48
-
49
-
50
-
51
-
52
-
53
-
54
-
55
-
56
-
57
-
58
-
59
-
60
-
61
-
62
-
63
-
64
-
65
-
66
-
67
-
68
-
69
-
70
-
71
-
72
-
73
-
74
-
75
-
76
-
 77
77 -
 78
78 -
 79
79 -
 80
80 -
 81
81 -
 82
82 -
 83
83 -
 84
84 -
 85
85 -
 86
86 -
 87
87 -
 88
88 -
 89
89 -
 90
90 -
 91
91 -
 92
92 -
 93
93 -
 94
94 -
 95
95 -
 96
96 -
 97
97 -
98
-
99
-
100
-
101
-
102
-
103
-
104
-
105
-
106
-
107
-
108
-
109
-
110
-
111
-
112
-
113
-
114
-
115
-
116
-
117
-
118
-
119
-
120
-
121
-
122
-
123
-
124
-
125
-
126
-
127
-
128
-
129
-
130
-
131
-
132
-
133
-
134
-
135
-
136
-
137
-
138
-
139
-
140
-
141
-
142
-
143
-
144
-
145
-
146
-
147
-
148
-
149
-
150
-
151
-
152
-
153
-
154
-
155
-
156
-
157
-
158
-
159
-
160
-
161
-
162
-
163
-
164
-
165
-
166
-
167
-
168
-
169
-
170
-
171
-
172
-
173
-
174
-
175
-
176
-
177
-
178
-
179
-
180
-
181
-
182
-
183
-
184
-
185
-
186
-
187
-
188
-
189
-
190
-
191
-
192
-
193
-
194
-
195
-
196
-
197
-
198
-
199
-
200
-
201
-
202
-
203
-
204
-
205
-
206
-
207
-
208
-
209
-
210
-
211
-
212
-
213
-
214
-
215
-
216
-
217
-
218
-
219
-
220
-
221
-
222
-
223
-
224
-
225
-
226
-
227
-
228
-
229
-
230
-
231
-
232
-
233
-
234
-
235
-
236
-
237
-
238
-
239
-
240
-
241
 |
 |

Table of Contents
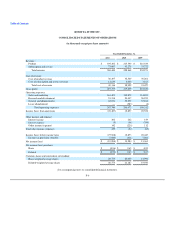
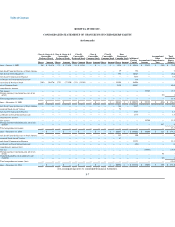
ROSETTA STONE INC.
CONSOLIDATED STATEMENTS OF CHANGES IN STOCKHOLDERS' EQUITY
(in thousands)
Class A, Series A-1
Convertible
Preferred Stock
Class A, Series A-2
Convertible
Preferred Stock
Class B
Convertible
Preferred Stock
Class A
Convertible
Common Stock
Class B
Convertible
Common Stock
Non-
Designated
Common Stock
Accumulated
Other
Comprehensive
Loss
Total
Stockholders'
Equity
(Deficit)
Additional
Paid-in
Capital Accumulated
Income
Shares Amount Shares Amount Shares Amount Shares Amount Shares Amount Shares Amount
Balance—January 1, 2009 269 $ 26,876 178 $ 17,820 111 $ 11,341 — $ — — $ — 1,936 $ 1 $ 10,814 $ 12,422 $ (203) $ 79,071
Stock Issed Upon the Exercise of Stock Options — — — — — — — — — — 89 — 386 — — 386
Stock Issued to Key Employees — — — — — — — — — — 591 — 10,647 — — 10,647
Stock-based Compensation Expense — — — — — — — — — — — — 3,616 — — 3,616
Tax Benefit on Stock Option Exercised 336 336
Conversion of Preferred Stock (269) (26,876) (178) (17,820) (111) (11,341) — — — — 14,508 1 56,036 — — —
Sale of Common Stock 3,125 49,037 49,037
Comprehensive income:
Net income — — — — — — — — — — — — — 13,363 — 13,363
Foreign currency translation loss, net of tax
of $(8) — — — — — — — — — — — — — — (21) (21
Total comprehensive income — — — — — — — — — — — — — — — 13,342
Balance—December 31, 2009 — $ — — $ — — $ — — $ — — $ — 20,249 $ 2 $ 130,872 $ 25,785 $ (224) $ 156,435
Stock Issed Upon the Exercise of Stock Options — — — — — — — — — — 364 — 2,387 — — 2,387
Restricted Stock Award Vesting — — — — — — — — — — 54
Stock-based Compensation Expense — — — — — — — — — — — — 4,387 — — 4,387
Tax Benefit on Stock Option Exercised — — — — — — — — — — — — 1,376 — — 1,376
Comprehensive income:
Net income — — — — — — — — — — — — — 13,284 — 13,284
Foreign currency translation gain, net of tax
of $110 — — — — — — — — — — — — — — 447 447
Total comprehensive income — — — — — — — — — — — — — — — 13,731
Balance—December 31, 2010 — $ — — $ — — $ — — $ — — $ — 20,667 $ 2 $ 139,022 $ 39,069 $ 223 $ 178,316
Stock Issed Upon the Exercise of Stock Options — — — — — — — — — — 182 — 800 — — 800
Restricted Stock Award Vesting — — — — — — — — — — 87
Stock-based Compensation Expense — — — — — — — — — — — — 12,353 — — 12,353
Tax Benefit on Stock Option Exercised — — — — — — — — — — — — (351) — — (351
Comprehensive income (loss):
Net loss — — — — — — — — — — — — — (19,988) — (19,988
Foreign currency translation gain, net of tax
of $46 — — — — — — — — — — — — — — 98 98
Unrealized gain/loss on available-for-sale
securities — — — — — — — — — — — — — — (23) (23
Total comprehensive income (loss) — — — — — — — — — — — — — — — (19,913
Balance—December 31, 2011 — $ — — $ — — $ — — $ — — $ — 20,936 $ 2 $ 151,824 $ 19,081 $ 298 $ 171,205
See accompanying notes to consolidated financial statements.
F-7