Rosetta Stone 2011 Annual Report Download - page 65
Download and view the complete annual report
Please find page 65 of the 2011 Rosetta Stone annual report below. You can navigate through the pages in the report by either clicking on the pages listed below, or by using the keyword search tool below to find specific information within the annual report.-
 1
1 -
2
-
3
-
4
-
5
-
6
-
7
-
8
-
9
-
10
-
11
-
12
-
13
-
14
-
15
-
16
-
17
-
18
-
19
-
20
-
21
-
22
-
23
-
24
-
25
-
26
-
27
-
28
-
29
-
30
-
31
-
32
-
33
-
34
-
35
-
36
-
37
-
38
-
39
-
40
-
41
-
42
-
43
-
44
-
45
-
46
-
47
-
48
-
49
-
50
-
51
-
52
-
53
-
54
-
 55
55 -
 56
56 -
 57
57 -
 58
58 -
 59
59 -
 60
60 -
 61
61 -
 62
62 -
 63
63 -
 64
64 -
 65
65 -
 66
66 -
 67
67 -
 68
68 -
 69
69 -
 70
70 -
 71
71 -
 72
72 -
 73
73 -
 74
74 -
 75
75 -
76
-
77
-
78
-
79
-
80
-
81
-
82
-
83
-
84
-
85
-
86
-
87
-
88
-
89
-
90
-
91
-
92
-
93
-
94
-
95
-
96
-
97
-
98
-
99
-
100
-
101
-
102
-
103
-
104
-
105
-
106
-
107
-
108
-
109
-
110
-
111
-
112
-
113
-
114
-
115
-
116
-
117
-
118
-
119
-
120
-
121
-
122
-
123
-
124
-
125
-
126
-
127
-
128
-
129
-
130
-
131
-
132
-
133
-
134
-
135
-
136
-
137
-
138
-
139
-
140
-
141
-
142
-
143
-
144
-
145
-
146
-
147
-
148
-
149
-
150
-
151
-
152
-
153
-
154
-
155
-
156
-
157
-
158
-
159
-
160
-
161
-
162
-
163
-
164
-
165
-
166
-
167
-
168
-
169
-
170
-
171
-
172
-
173
-
174
-
175
-
176
-
177
-
178
-
179
-
180
-
181
-
182
-
183
-
184
-
185
-
186
-
187
-
188
-
189
-
190
-
191
-
192
-
193
-
194
-
195
-
196
-
197
-
198
-
199
-
200
-
201
-
202
-
203
-
204
-
205
-
206
-
207
-
208
-
209
-
210
-
211
-
212
-
213
-
214
-
215
-
216
-
217
-
218
-
219
-
220
-
221
-
222
-
223
-
224
-
225
-
226
-
227
-
228
-
229
-
230
-
231
-
232
-
233
-
234
-
235
-
236
-
237
-
238
-
239
-
240
-
241
 |
 |

Table of Contents
$0.6 million decrease in expense for the year ended December 31, 2010. For the year ended December 31, 2011, there were no lease abandonment expenses.
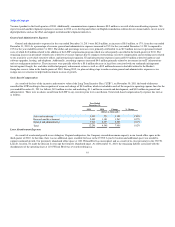
Interest and Other Income (Expense)
Year Ended
December 31, 2011 versus 2010
2011 2010 Change % Change
(in thousands, except percentages)
Interest Income 302 $ 262 $ 40 15.3%
Interest Expense (5) (66) 61 92.4%
Other Income (Expense) 142 (220) 362 164.5%
Total $ 439 $ (24) $ 463 1929.2%
Interest income represents interest earned on our cash and cash equivalents. Interest income for the year ended December 31, 2011 was $302,000, an
increase of $40,000, or 15%, from the year ended December 31, 2010.
Interest expense is primarily related to our short-term investment account as well as interest related to our capital leases. Interest expense for the year
ended December 31, 2011 was $5,000, a decrease of $61,000 or 92%, from the year ended December 31, 2010.
We expect interest expense to be minimal in upcoming quarters as we allowed the revolving line of credit with Wells Fargo to expire on January 17,
2011.
Other income for the year ended December 31, 2011 was $142,000, an increase of $0.4 million, or 165%, from the year ended December 31, 2010. The
increase was primarily due to an increase in foreign exchange gains and an increase in copyright infringement settlements compared to the prior year period.
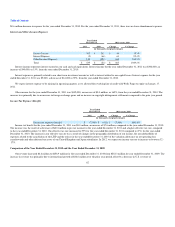
Income Tax Expense (Benefit)
Year Ended
December 31, 2011 versus 2010
2011 2010 Change % Change
(in thousands, except percentages)
Income tax expense (benefit) $ (7,980) $ (411) $ (7,569) 1841.6%
Income tax benefit for the year ended December 31, 2011 was $8.0 million, an increase of $7.6 million, compared to the year ended December 31, 2010.
The increase was the result of a decrease of $40.8 million in pre-tax income for the year ended December 31, 2011 and a higher effective tax rate, compared
to the year ended December 31, 2010. Our effective tax rate increased to 29% for the year ended December 31, 2011 compared to (3%) for the year ended
December 31, 2010. The increase in our effective tax rate was a result of changes in the geographic distribution of our income, the non-deductibility of
expenses related to the cancellation of the LTIP and the release in the year ended December 31, 2010 of the valuation allowance on net operating loss
carryforwards and other deferred tax assets of our United Kingdom and Japan subsidiaries. In 2012, we expect our income tax rate to increase to between 32 -
37%.
Comparison of the Year Ended December 31, 2010 and the Year Ended December 31, 2009
Our revenue increased $6.6 million to $258.9 million for the year ended December 31, 2010 from $252.3 million for year ended December 31, 2009. The
increase in revenue was primarily due to international growth of $26.8 million over the prior year period, offset by a decrease in U.S. revenue of
62