Rosetta Stone 2011 Annual Report Download - page 67
Download and view the complete annual report
Please find page 67 of the 2011 Rosetta Stone annual report below. You can navigate through the pages in the report by either clicking on the pages listed below, or by using the keyword search tool below to find specific information within the annual report.-
 1
1 -
2
-
3
-
4
-
5
-
6
-
7
-
8
-
9
-
10
-
11
-
12
-
13
-
14
-
15
-
16
-
17
-
18
-
19
-
20
-
21
-
22
-
23
-
24
-
25
-
26
-
27
-
28
-
29
-
30
-
31
-
32
-
33
-
34
-
35
-
36
-
37
-
38
-
39
-
40
-
41
-
42
-
43
-
44
-
45
-
46
-
47
-
48
-
49
-
50
-
51
-
52
-
53
-
54
-
55
-
56
-
 57
57 -
 58
58 -
 59
59 -
 60
60 -
 61
61 -
 62
62 -
 63
63 -
 64
64 -
 65
65 -
 66
66 -
 67
67 -
 68
68 -
 69
69 -
 70
70 -
 71
71 -
 72
72 -
 73
73 -
 74
74 -
 75
75 -
 76
76 -
 77
77 -
78
-
79
-
80
-
81
-
82
-
83
-
84
-
85
-
86
-
87
-
88
-
89
-
90
-
91
-
92
-
93
-
94
-
95
-
96
-
97
-
98
-
99
-
100
-
101
-
102
-
103
-
104
-
105
-
106
-
107
-
108
-
109
-
110
-
111
-
112
-
113
-
114
-
115
-
116
-
117
-
118
-
119
-
120
-
121
-
122
-
123
-
124
-
125
-
126
-
127
-
128
-
129
-
130
-
131
-
132
-
133
-
134
-
135
-
136
-
137
-
138
-
139
-
140
-
141
-
142
-
143
-
144
-
145
-
146
-
147
-
148
-
149
-
150
-
151
-
152
-
153
-
154
-
155
-
156
-
157
-
158
-
159
-
160
-
161
-
162
-
163
-
164
-
165
-
166
-
167
-
168
-
169
-
170
-
171
-
172
-
173
-
174
-
175
-
176
-
177
-
178
-
179
-
180
-
181
-
182
-
183
-
184
-
185
-
186
-
187
-
188
-
189
-
190
-
191
-
192
-
193
-
194
-
195
-
196
-
197
-
198
-
199
-
200
-
201
-
202
-
203
-
204
-
205
-
206
-
207
-
208
-
209
-
210
-
211
-
212
-
213
-
214
-
215
-
216
-
217
-
218
-
219
-
220
-
221
-
222
-
223
-
224
-
225
-
226
-
227
-
228
-
229
-
230
-
231
-
232
-
233
-
234
-
235
-
236
-
237
-
238
-
239
-
240
-
241
 |
 |

Table of Contents
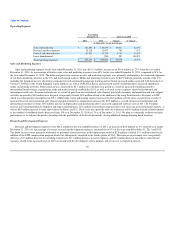
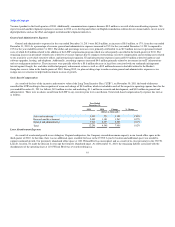
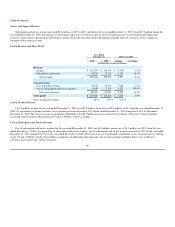
Product revenue represented 97% of total consumer revenue for the year ended December 31, 2010, with the balance attributable to subscription and
service revenue. We began bundling time-based subscription licenses of our web-based TOTALe Studio and Rosetta World services with perpetual licenses of
the Rosetta Course, which previously comprised our Rosetta Stone Version 3 language-learning solutions, in the U.S. consumer market during the third
quarter of 2010 with the launch of Rosetta Stone Version 4 TOTALe. As a result, we defer approximately 10% - 25% of each of these bundled sales. We will
recognize the deferred revenue over the term of the subscription license in accordance with Accounting Standards Codification subtopic 985-605, Software:
Revenue Recognition.
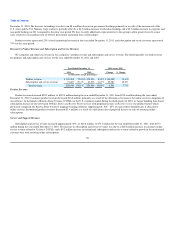
Direct-to-Consumer
Direct-to-consumer revenue was $118.2 million for the year ended December 31, 2010, an increase of $2.4 million or 2%, from the year ended
December 31, 2009. The increase in direct-to-consumer revenue was driven by $17.9 million in growth in our international direct-to-consumer markets offset
by a $15.5 million decrease in our U.S. direct-to-consumer business. The worldwide average selling price per unit increased 3% during the year ended
December 31, 2010 compared to the prior year period, resulting in a $3.5 million increase in revenue. Units sold increased 4% during the year ended
December 31, 2010 compared to the prior year period, resulting in a $4.1 million increase in revenue. There was a $4.8 million increase in deferred revenue
during the year ended December 31, 2010 compared to the prior year period, which was primarily deferred revenue for Version 4 TOTALe online services.
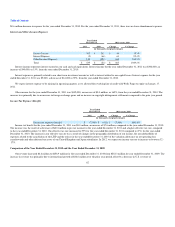
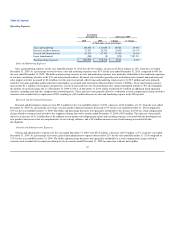
Kiosk
Kiosk revenue was $35.0 million for the year ended December 31, 2010, a decrease of $5.6 million, or 14%, from the year ended December 31, 2009.
Despite the increase in the number of worldwide kiosks from 242 to 259 during the year ended December 31, 2010, annual net revenue per kiosk declined due
to lower foot traffic. The worldwide average selling price per unit increased 5% during the year ended December 31, 2010 compared to the prior year period,
resulting in a $1.9 million increase in revenue. The number of units sold decreased 13% during the year ended December 31, 2010 compared to the prior year
period, resulting in a $5.2 million decrease in revenue, primarily due to the decrease in the number of kiosks. We continually reviewed kiosk performance for
the remainder of 2011 and we may continue to close our underperforming kiosk locations. There was a $2.3 million increase in deferred revenue during the
year ended December 31, 2010 compared to the prior year period, which was primarily deferred revenue for Version 4 TOTALe online services.
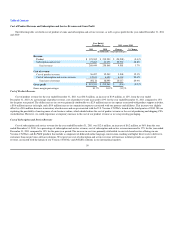
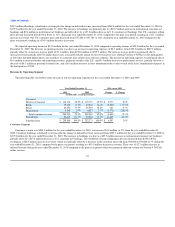
Retail
Retail revenue was $46.1 million for the year ended December 31, 2010, an increase of $0.2 million or 0.3% from the year ended December 31, 2009.
The worldwide average selling price per unit increased 33% during the year ended December 31, 2010 compared to the prior year period, resulting in a
$12.9 million increase in revenue, partially offset by a 17% decrease in units sold during the year ended December 31, 2010 compared to the prior year
period, resulting in a $7.7 million decrease in revenue. There was a $5.7 million increase in deferred revenue during the year ended December 31, 2010
compared to the prior year period, which was primarily deferred revenue for Version 4 TOTALe online services.
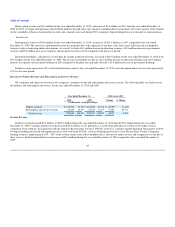
Home School
During the year ended December 31, 2010, we reclassified our home school sales vertical from Institutional to Consumer. We believe the drivers of
acquiring a home school customer are more aligned with a typical sale in our consumer sales vertical. Prior year information has been modified to conform to
current year presentation.
64