Radio Shack 2012 Annual Report Download - page 32
Download and view the complete annual report
Please find page 32 of the 2012 Radio Shack annual report below. You can navigate through the pages in the report by either clicking on the pages listed below, or by using the keyword search tool below to find specific information within the annual report.
30
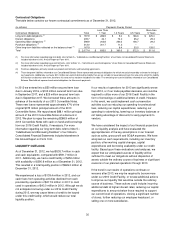
Contractual Obligations
The table below contains our known contractual commitments as of December 31, 2012.
(In millions) Payments Due by Period
Contractual Obligations
Total
Less Than
1 Year
1-3 Years
3-5 Years
More than
5 Years
Long-term debt obligations
(1)
$ 787.9 $ 286.9 $ 9.4 $ 166.6 $ 325.0
Interest obligations 209.7 42.1 73.0 65.2 29.4
Operating lease obligations
(2)
598.9 202.8 260.2 106.7 29.2
Purchase obligations
(3)
313.0 301.7 11.3 -- --
Other long-term liabilities reflected on the balance sheet
(4)
167.9 6.4 33.5 128.0
Total $ 2,077.4 $ 833.5 $ 360.3 $ 372.0 $ 511.6
(1) For more information regarding long-term debt, refer to Note 5 – “Indebtedness and Borrowing Facilities” of our Notes to Consolidated Financial Statements
included elsewhere in this Annual Report on Form 10-K.
(2) For more information regarding lease commitments, refer to Note 14 – “Commitments and Contingencies” of our Notes to Consolidated Financial Statements
included elsewhere in this Annual Report on Form 10-K.
(3) Purchase obligations primarily include our product commitments and marketing agreements.
(4) These long-term liabilities reflected on our Consolidated Balance Sheet represented contractual obligations for which we could reasonably estimate the timing of
cash payments. Additionally, we had a $21.2 million non-current deferred tax liability that we are not able to reasonably estimate the amount by which this liability
will increase or decrease over time; therefore, this amount has not been
included in the table. The remaining non-current liabilities reflected on our Consolidated
Balance Sheet did not represent contractual obligations for future cash payments.
In 2012 we entered into a $50 million secured term loan
due in January 2016, a $100 million secured term loan due
in September 2017, and a $25 million secured term loan
due in September 2017. We borrowed these amounts in
advance of the maturity of our 2013 Convertible Notes.
These new loans represented approximately 47% of the
original $375 million principal amount of the 2013
Convertible Notes. We repurchased $88.1 million principal
amount of the 2013 Convertible Notes at a discount in
2012. We plan to repay the remaining $286.9 million of
2013 Convertible Notes with cash on hand and borrowings
from our 2016 Credit Facility, if necessary. For more
information regarding our long-term debt, refer to Note 5 –
“Indebtedness and Borrowing Facilities” of our Notes to
Consolidated Financial Statements included elsewhere in
this Annual Report on Form 10-K.
LIQUIDITY OUTLOOK
As of December 31, 2012, we had $535.7 million in cash
and cash equivalents, compared with $591.7 million in
2011. Additionally, we had a credit facility of $450 million
with availability of $390.6 million as of December 31, 2012.
This resulted in a total liquidity position of $926.3 million at
December 31, 2012.
We experienced a loss of $139.4 million in 2012, and our
cash flows from operating activities declined from cash
provided by operations of $217.9 million in 2011 to cash
used in operations of $43.0 million in 2012. Although we do
not anticipate borrowing under our 2016 Credit Facility
during 2013, we may cause letters of credit to be issued
under this credit facility, which would reduce our total
liquidity position.
If our results of operations for 2013 are significantly worse
than 2012, or if our trade payables decrease, we could be
required to utilize more of our 2016 Credit Facility in the
form of borrowings or additional letters of credit. However,
in this event, we could implement cash conservation
activities such as reducing our spending for professional
fees, reducing our capital expenditures, reducing our
spending for advertising, lowering our inventory balances or
not taking advantage of discounts for early payments to
vendors.
We have considered the impact of our financial projections
on our liquidity analysis and have evaluated the
appropriateness of the key assumptions in our forecast
such as sales, gross profit and SG&A expenses. We have
analyzed our cash requirements, including our inventory
position, other working capital changes, capital
expenditures and borrowing availability under our credit
facility. Based upon these evaluations and analyses, we
expect that our anticipated sources of liquidity will be
sufficient to meet our obligations without disposition of
assets outside the ordinary course of business or significant
revisions of our planned operations through 2013.
If the trend in our results of operations continues or
worsens after 2013, we may be required to borrow more
under our 2016 Credit Facility, or to take additional actions
to improve our liquidity that would be outside the ordinary
course of business. These actions could include: incurring
additional debt at higher interest rates, reducing our capital
expenditures to amounts below those required to support
our current level of operations, closing a significant number
of stores, further reducing our employee headcount, or
selling one or more subsidiaries.


