Radio Shack 2012 Annual Report Download - page 26
Download and view the complete annual report
Please find page 26 of the 2012 Radio Shack annual report below. You can navigate through the pages in the report by either clicking on the pages listed below, or by using the keyword search tool below to find specific information within the annual report.-
 1
1 -
2
-
3
-
4
-
5
-
6
-
7
-
8
-
9
-
10
-
11
-
12
-
13
-
14
-
15
-
 16
16 -
 17
17 -
 18
18 -
 19
19 -
 20
20 -
 21
21 -
 22
22 -
 23
23 -
 24
24 -
 25
25 -
 26
26 -
 27
27 -
 28
28 -
 29
29 -
 30
30 -
 31
31 -
 32
32 -
 33
33 -
 34
34 -
 35
35 -
 36
36 -
37
-
38
-
39
-
40
-
41
-
42
-
43
-
44
-
45
-
46
-
47
-
48
-
49
-
50
-
51
-
52
-
53
-
54
-
55
-
56
-
57
-
58
-
59
-
60
-
61
-
62
-
63
-
64
-
65
-
66
-
67
-
68
-
69
-
70
-
71
-
72
-
73
-
74
-
75
-
76
-
77
-
78
-
79
-
80
-
81
-
82
-
83
-
84
-
85
-
86
-
87
-
88
-
89
-
90
-
91
-
92
 |
 |

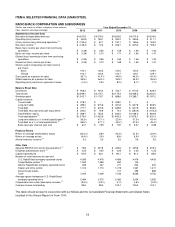
24
Selling, General and Administrative Expense
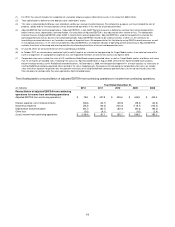
Our consolidated SG&A expense decreased 3.1%, or $48.4 million, in 2012. SG&A as a percentage of net sales and operating
revenues was essentially flat when compared with 2011. The table below summarizes the breakdown of various components
of our consolidated SG&A expense and their related percentages of total net sales and operating revenues.
Year Ended December 31,
2012 2011 2010
Dollars
% of
Sales &
Revenues
Dollars
% of
Sales &
Revenues
Dollars
% of
Sales &
Revenues
(In millions)
Compensation $ 696.4 16.4% $ 693.4 15.8% $ 663.1 15.5%
Rent and occupancy 252.3 5.9 261.5 6.0 265.3 6.2
Advertising 182.9 4.3 208.9 4.8 205.9 4.8
Other taxes (excludes income taxes) 108.7 2.6 108.3 2.5 97.7 2.3
Utilities 53.5 1.3 56.0 1.3 54.4 1.3
Insurance 46.6 1.1 49.6 1.1 45.9 1.1
Credit card fees 35.9 0.8 35.6 0.8 34.9 0.8
Professional fees 30.5 0.7 26.7 0.6 21.3 0.5
Repairs and maintenance 22.9 0.5 25.7 0.6 20.1 0.5
Licenses 14.5 0.3 14.9 0.3 13.2 0.3
Printing, postage and office supplies 9.3 0.2 9.0 0.2 6.9 0.2
Recruiting, training and employee relations 6.3 0.1 6.5 0.1 5.4 0.1
Travel 6.1 0.1 6.4 0.1 4.9 0.1
Matching contributions to savings plans 5.1 0.1 4.9 0.1 5.4 0.1
Other 58.0 1.5 70.0 1.7 39.4 1.0
$ 1,529.0 35.9% $ 1,577.4 36.0% $ 1,483.8 34.8%
The decrease in SG&A expense was driven by decreased
advertising expense, decreased rent and occupancy
expense, and decreased compensation expense in the
second half of 2012. Additionally, SG&A in 2012 was lower
due to a one-time $23.4 million charge in 2011 related to
our transition from T-Mobile to Verizon and a one-time $9.5
million charge in 2011 related to the closure of our Chinese
manufacturing plant. These decreases were partially offset
by increased costs in the first half of 2012 to support
additional Target Mobile centers that were not open in the
same period last year and severance costs of $8.5 million
in connection with the departure of our Chief Executive
Officer combined with the termination of employment of
certain corporate headquarters support staff in the third
quarter of 2012.
We announced on September 25, 2012, that our Board of
Directors and Mr. James F. Gooch had agreed that Mr.
Gooch would step down from his position as Chief
Executive Officer and as a director of the Company,
effective immediately. Under Mr. Gooch’s employment
agreement, he was entitled to a specified cash payment
and the accelerated vesting of certain stock awards. During
the third quarter ended September 30, 2012, we recorded
$5.6 million of employee separation charges in connection
with Mr. Gooch’s departure. This included a cash charge of
$4.0 million and a non-cash charge of $1.6 million related to
the accelerated vesting of stock awards.
During the third quarter ended September 30, 2012, we
recorded $2.9 million of employee separation charges in
connection with the termination of the employment of
approximately 150 employees, who worked primarily at our
corporate headquarters.
Depreciation and Amortization
The table below provides a summary of our total
depreciation and amortization by segment.
Year Ended December 31,
(In millions) 2012 2011
2010
U.S. RadioShack
company-operated stores
$ 31.8
$ 37.9
$ 45.4
Target Mobile centers 6.4 4.7 1.5
Other 3.8 4.0 3.7
Unallocated 38.7 36.1 32.8
Total depreciation and
amortization from continuing
operations
$ 80.7
$ 82.7
$ 83.4
The table below provides an analysis of total depreciation
and amortization.
Year Ended December 31,
(In millions) 2012 2011
2010
Depreciation and
amortization expense
$ 72.3
$ 75.2
$ 75.7
Depreciation and
amortization included
in cost of products sold
8.4
7.5
7.7
Total depreciation and
amortization from continuing
operations
$ 80.7
$ 82.7
$ 83.4