Radio Shack 2012 Annual Report Download - page 20
Download and view the complete annual report
Please find page 20 of the 2012 Radio Shack annual report below. You can navigate through the pages in the report by either clicking on the pages listed below, or by using the keyword search tool below to find specific information within the annual report.-
 1
1 -
2
-
3
-
4
-
5
-
6
-
7
-
8
-
9
-
 10
10 -
 11
11 -
 12
12 -
 13
13 -
 14
14 -
 15
15 -
 16
16 -
 17
17 -
 18
18 -
 19
19 -
 20
20 -
 21
21 -
 22
22 -
 23
23 -
 24
24 -
 25
25 -
 26
26 -
 27
27 -
 28
28 -
 29
29 -
 30
30 -
31
-
32
-
33
-
34
-
35
-
36
-
37
-
38
-
39
-
40
-
41
-
42
-
43
-
44
-
45
-
46
-
47
-
48
-
49
-
50
-
51
-
52
-
53
-
54
-
55
-
56
-
57
-
58
-
59
-
60
-
61
-
62
-
63
-
64
-
65
-
66
-
67
-
68
-
69
-
70
-
71
-
72
-
73
-
74
-
75
-
76
-
77
-
78
-
79
-
80
-
81
-
82
-
83
-
84
-
85
-
86
-
87
-
88
-
89
-
90
-
91
-
92
 |
 |

18
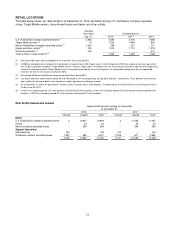
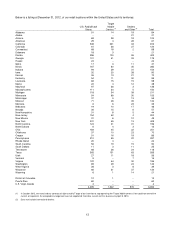
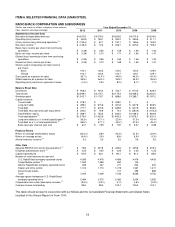
ITEM 6. SELECTED FINANCIAL DATA (UNAUDITED).
RADIOSHACK CORPORATION AND SUBSIDIARIES
(Dollars and shares in millions, except per share amounts,
ratios, locations and square footage)
Year Ended December 31,
2012 2011 2010 2009 2008
Statements of Income Data
Net sales and operating revenues $ 4,257.8 $ 4,378.0 $ 4,265.8 $ 4,073.6 $ 4,034.8
Operating (loss) income $ (60.9) $ 155.1 $ 350.2 $ 355.5 $ 311.1
(Loss) income from continuing operations
(1)
$ (139.4) $ 67.1 $ 190.7 $ 196.5 $ 183.2
Net (loss) income
(1)
$ (139.4) $ 72.2 $ 206.1 $ 205.0 $ 189.4
Basic (loss) income per share from continuing
operations
$ (1.39)
$ 0.65
$ 1.58
$ 1.56
$ 1.42
Basic net (loss) income per share $ (1.39) $ 0.70 $ 1.71 $ 1.63 $ 1.47
Diluted (loss) income per share from continuing
operations
$ (1.39)
$ 0.65
$ 1.55
$ 1.56
$ 1.42
Diluted net (loss) income per share $ (1.39) $ 0.70 $ 1.68 $ 1.63 $ 1.47
Shares used in computing net (loss) income
per share:
Basic 100.1 102.5 120.5 125.4 129.0
Diluted 100.1 103.3 122.7 126.1 129.1
Gross profit as a percent of sales 36.7% 41.4% 44.9% 46.0% 45.4%
SG&A expense as a percent of sales 35.9% 36.0% 34.8% 35.2% 35.6%
Operating (loss) income as a percent of sales (1.4%) 3.5% 8.2% 8.7% 7.7%
Balance Sheet Data
Inventories $ 908.3 $ 744.4 $ 723.7 $ 670.6 $ 636.3
Total assets $ 2,299.1 $ 2,175.1 $ 2,175.4 $ 2,429.3 $ 2,254.0
Working capital $ 1,003.7 $ 1,176.7 $ 898.6 $ 1,389.7 $ 1,187.2
Capital structure:
Current debt $ 278.7 $ -- $ 308.0 $ -- $ --
Long-term debt $ 499.0 $ 670.6 $ 331.8 $ 627.8 $ 659.5
Total debt $ 777.7 $ 670.6 $ 639.8 $ 627.8 $ 659.5
Total debt less cash and cash equivalents $ 242.0 $ 78.9 $ 70.4 $ (280.4) $ (155.3)
Stockholders' equity $ 598.7 $ 753.3 $ 842.5 $ 1,048.3 $ 860.8
Total capitalization
(2
)
$ 1,376.4 $ 1,423.9 $ 1,482.3 $ 1,676.1 $ 1,520.3
Long-term debt as a % of total capitalization
(2
)
36.3% 47.1% 22.4% 37.5% 43.4%
Total debt as a % of total capitalization
(2
)
56.5% 47.1% 43.2% 37.5% 43.4%
Book value per share at year end $ 6.01 $ 7.59 $ 7.97 $ 8.37 $ 6.88
Financial Ratios
Return on average stockholders' equity (20.2%) 8.8% 20.3% 21.5% 22.9%
Return on average assets (6.4%) 3.5% 8.9% 8.9% 9.3%
Annual inventory turnover
(3
)
3.3 3.5 3.5 3.6 3.5
Other Data
Adjusted EBITDA from continuing operations
(4
)
$ 19.8 $ 237.8 $ 433.6 $ 445.8 $ 405.3
Dividends declared per share
(
5
)
$ 0.25 $ 0.50 $ 0.25 $ 0.25 $ 0.25
Capital expenditures $ 67.8 $ 82.1 $ 80.1 $ 81.0 $ 85.6
Number of retail locations at year end:
U.S. RadioShack company-operated stores 4,395 4,476 4,486 4,476 4,453
Target Mobile centers
(
6
)
1,522 1,496 850 104 --
Mexico RadioShack company-operated stores 269 227 211 204 200
Dealer and other outlets 1,014 1,110 1,219 1,321 1,411
Discontinued kiosks -- -- 417 458 688
Total 7,200 7,309 7,183 6,563 6,752
Average square footage per U.S. RadioShack
company-operated store
2,464
2,473
2,482
2,504
2,505
Comparable store sales (decrease) increase
(
7
)
(3.5%) (2.2%) 4.1% 0.8% (0.9%)
Common shares outstanding 99.6 99.3 105.7 125.2 125.1
This table should be read in conjunction with our MD&A and the Consolidated Financial Statements and related Notes
included in this Annual Report on Form 10-K.