Radio Shack 2012 Annual Report Download - page 29
Download and view the complete annual report
Please find page 29 of the 2012 Radio Shack annual report below. You can navigate through the pages in the report by either clicking on the pages listed below, or by using the keyword search tool below to find specific information within the annual report.-
 1
1 -
2
-
3
-
4
-
5
-
6
-
7
-
8
-
9
-
10
-
11
-
12
-
13
-
14
-
15
-
16
-
17
-
18
-
 19
19 -
 20
20 -
 21
21 -
 22
22 -
 23
23 -
 24
24 -
 25
25 -
 26
26 -
 27
27 -
 28
28 -
 29
29 -
 30
30 -
 31
31 -
 32
32 -
 33
33 -
 34
34 -
 35
35 -
 36
36 -
 37
37 -
 38
38 -
 39
39 -
40
-
41
-
42
-
43
-
44
-
45
-
46
-
47
-
48
-
49
-
50
-
51
-
52
-
53
-
54
-
55
-
56
-
57
-
58
-
59
-
60
-
61
-
62
-
63
-
64
-
65
-
66
-
67
-
68
-
69
-
70
-
71
-
72
-
73
-
74
-
75
-
76
-
77
-
78
-
79
-
80
-
81
-
82
-
83
-
84
-
85
-
86
-
87
-
88
-
89
-
90
-
91
-
92
 |
 |

27
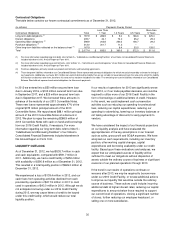
with Bank of America, N.A., as administrative and collateral
agent (the “2016 Credit Facility”). Non-cash interest
expense was $17.0 million in 2011 compared with $15.2
million in 2010.
Income Tax Expense
Our effective tax rate for 2011 was 37.5%, compared with
38.7% for 2010. The 2011 effective tax rate was affected by
the realization of job retention credits generated pursuant to
the Hiring Incentives to Restore Employment Act. These
credits lowered the effective tax rate by 1.1 percentage
points.
The 2010 effective tax rate was affected by the net reversal
of approximately $1.2 million in previously unrecognized tax
benefits, deferred tax assets and accrued interest due to
the effective settlement of state income tax matters during
the period. These discrete items lowered the effective tax
rate by 0.4 percentage points.
RECENTLY ISSUED ACCOUNTING
PRONOUNCEMENTS
Refer to Note 2 – “Summary of Significant Accounting
Policies” under the section titled “New Accounting
Standards” in the Notes to Consolidated Financial
Statements.
LIQUIDITY AND CAPITAL RESOURCES
Cash Flow Overview
Operating Activities: Cash used in operating activities in
2012 was $43.0 million, compared with cash provided by
operating activities of $217.9 million in 2011. Cash flows
from operating activities are comprised of net income or
loss plus non-cash adjustments to net income or loss and
the net changes in assets and liabilities. The amounts of
cash provided by net income or loss plus non-cash
adjustments to net income or loss were $59.9 million and
$215.4 million in 2012 and 2011, respectively. The
decrease in net income plus non-cash adjustments was
primarily driven by our net loss in 2012 of $139.4 million
compared with a net income of $72.2 million in 2011. The
amount of cash used by the net changes in assets and
liabilities was $102.9 million in 2012, compared with cash
provided by the net changes in assets and liabilities of $2.5
million in 2011. The increase in cash used by the net
changes in assets and liabilities in 2012 was primarily
driven by cash used for our increased inventory balance at
December 31, 2012, which was partially offset by income
tax refunds of $118.6 million and by cash provided by our
increased accounts payable balance. Our inventory
balance was larger at December 31, 2012, than it was at
December 31, 2011, primarily due to a higher average unit
cost of, and larger quantities of, wireless handsets. The
increase in inventory was also driven by increased
inventory in our higher-margin signature platform, which
was primarily driven by increased wireless accessories and
headphones.
Investing Activities: The amounts of cash used in
investing activities were $94.2 million and $80.1 million in
2012 and 2011, respectively. This change was driven by
the increase in our restricted cash balance, which was
partially offset by decreased capital expenditures in 2012.
For further discussion of our restricted cash, see “Cash
Requirements” later in this MD&A. Capital expenditures
were $67.8 million in 2012 compared with $82.1 million in
2011. This decrease was primarily driven by higher capital
expenditures for our Target Mobile centers in 2011 when
we opened many of these locations. Capital expenditures
primarily related to our U.S. RadioShack company-operated
stores and information system projects in 2012 and 2011.
Our capital expenditures in 2011 also related to our Target
Mobile centers.
Financing Activities: Net cash provided by financing
activities was $81.2 million in 2012 compared with net cash
used in financing activities of $115.5 million in 2011. Our
net cash provided by financing activities in 2012 was
primarily due to the $175.0 million of new borrowings.
These borrowings were partially offset by the purchase of
$88.1 million principal amount of our 2013 Convertible
Notes and our dividend payments of $24.9 million. Our net
cash used in financing activities for 2011 was primarily
driven by the repurchase of $113.3 million of our common
stock and the payment of a $49.6 million annual dividend.
Free Cash Flow: Our free cash flow, defined as cash flows
from operating activities less dividends paid and additions to
property, plant and equipment, was a negative $135.7 million
in 2012, $86.2 million in 2011, and $48.4 million in 2010. The
decrease in free cash flow for 2012 was attributable to
decreased cash flow from operating activities as described
above.
We believe free cash flow is a relevant indicator of our
ability to repay maturing debt, change dividend payments or
fund other uses of capital that management believes will
enhance shareholder value. See “Liquidity Outlook” later in
this MD&A for further discussion of our sources of liquidity
and our cash requirements in future periods. The
comparable financial measure to free cash flow under
generally accepted accounting principles is net cash flows
provided by or used in operating activities. Net cash flows
used in operating activities was $43.0 million in 2012,
compared with net cash provided by operating activities of
$217.9 million and $155.0 million in 2011 and 2010,
respectively. We do not intend for the presentation of free
cash flow, a non-GAAP financial measure, to be considered
in isolation or as a substitute for measures prepared in
accordance with GAAP, nor do we intend to imply that free
cash flow represents cash flow available for discretionary