Radio Shack 2012 Annual Report Download - page 24
Download and view the complete annual report
Please find page 24 of the 2012 Radio Shack annual report below. You can navigate through the pages in the report by either clicking on the pages listed below, or by using the keyword search tool below to find specific information within the annual report.-
 1
1 -
2
-
3
-
4
-
5
-
6
-
7
-
8
-
9
-
10
-
11
-
12
-
13
-
 14
14 -
 15
15 -
 16
16 -
 17
17 -
 18
18 -
 19
19 -
 20
20 -
 21
21 -
 22
22 -
 23
23 -
 24
24 -
 25
25 -
 26
26 -
 27
27 -
 28
28 -
 29
29 -
 30
30 -
 31
31 -
 32
32 -
 33
33 -
 34
34 -
35
-
36
-
37
-
38
-
39
-
40
-
41
-
42
-
43
-
44
-
45
-
46
-
47
-
48
-
49
-
50
-
51
-
52
-
53
-
54
-
55
-
56
-
57
-
58
-
59
-
60
-
61
-
62
-
63
-
64
-
65
-
66
-
67
-
68
-
69
-
70
-
71
-
72
-
73
-
74
-
75
-
76
-
77
-
78
-
79
-
80
-
81
-
82
-
83
-
84
-
85
-
86
-
87
-
88
-
89
-
90
-
91
-
92
 |
 |

22
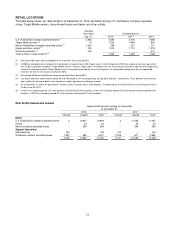
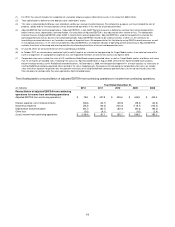
The following table provides a summary of our consolidated net sales and operating revenues by platform and as a percent of
net sales and operating revenues.
Consolidated Net Sales and Operating Revenues
Year Ended December 31,
(In millions) 2012 2011 2010
Mobility
(1)
$ 2,260.2 53.1%
$ 2,251.2 51.4%
$ 1,884.9 44.2%
Signature 1,293.3 30.4
1,265.8 28.9
1,314.9 30.8
Consumer electronics 661.9 15.5
831.1 19.0
1,030.7 24.2
Other sales
(
2
)
42.4 1.0
29.9 0.7
35.3 0.8
Consolidated net sales and operating revenues $ 4,257.8 100.0%
$ 4,378.0 100.0%
$ 4,265.8 100.0%
(1) The aggregate amounts of upfront commission revenue and residual income received from wireless service providers and recorded in this platform were
$1,333.9 million, $1,499.1 million and $1,270.5 million for 2012, 2011 and 2010, respectively.
(2) Other sales include outside sales from repair services and outside sales of our global sourcing operations and domestic and overseas manufacturing
facilities. We closed our overseas manufacturing facility in June 2011.
U.S. RadioShack Company-Operated Stores Segment
The following table provides a summary of our net sales and operating revenues by platform and as a percent of net sales and
operating revenues for the U.S. RadioShack company-operated stores segment.
U.S. RadioShack Company-Operated Stores Segment
Net Sales and Operating Revenues
Year Ended December 31,
(In millions) 2012 2011 2010
Mobility $ 1,781.2 51.5%
$ 1,851.4 50.5%
$ 1,753.7 46.0%
Signature 1,171.1 33.9
1,153.5 31.5
1,209.9 31.8
Consumer electronics 504.2 14.6
658.4 18.0
844.6 22.2
Net sales and operating revenues $ 3,456.5 100.0%
$ 3,663.3 100.0%
$ 3,808.2 100.0%
Sales in our U.S. RadioShack company-operated stores
segment decreased $206.8 million or 5.6% in 2012.
Sales in our mobility platform (which includes postpaid and
prepaid wireless handsets, commissions and residual
income, prepaid wireless airtime, e-readers, and tablet
devices) decreased 3.8% in 2012.
This decrease in sales was primarily driven by decreased
sales in our postpaid wireless business. This decrease was
partially offset by increased sales of tablet devices.
The sales decrease in our postpaid wireless business was
driven by a decrease in the number of postpaid units sold,
which was partially offset by an increase in the average
revenue per unit sold. The decrease in the number of
postpaid wireless handsets sold was primarily driven by
decreased unit sales in our Sprint and AT&T postpaid
wireless businesses.
Some of the factors contributing to our lower unit sales
were changes in Sprint’s customer and credit models and
the discontinuation of Sprint’s early upgrade program for
certain customers that began in mid-2011; higher sales in
the third quarter of 2011 related to a special wireless
handset promotion; the soft postpaid market due to
consumer anticipation of the iPhone 5 launch; and
inventory supply constraints during the initial iPhone 5
launch period.
The increase in the average revenue per postpaid unit was
primarily driven by a change in our sales mix towards
higher-priced smartphones, which was partially offset by an
increase in commissions repaid to wireless service
providers related to wireless handset deactivations. See the
executive summary of this MD&A for further discussion of
these wireless handset deactivations.
Sales in our signature platform (which includes accessories
for wireless, tablet, music, and home entertainment
products; batteries and power products; and technical
products) increased 1.5% in 2012. Product categories with
sales increases during this period included wireless
accessories, headphones, and tablet accessories. Product
categories with sales decreases during the period included
home entertainment accessories and personal computer
accessories.
Sales in our consumer electronics platform (which includes
laptop computers, residential telephones, toys, GPS units,
digital music players, personal computing products,
cameras, and other consumer electronics products)
decreased 23.4% in 2012. This sales decrease was driven
by sales declines in laptop computers, cameras, music
players, GPS devices, and televisions. The decrease in