Radio Shack 2012 Annual Report Download - page 25
Download and view the complete annual report
Please find page 25 of the 2012 Radio Shack annual report below. You can navigate through the pages in the report by either clicking on the pages listed below, or by using the keyword search tool below to find specific information within the annual report.-
 1
1 -
2
-
3
-
4
-
5
-
6
-
7
-
8
-
9
-
10
-
11
-
12
-
13
-
14
-
 15
15 -
 16
16 -
 17
17 -
 18
18 -
 19
19 -
 20
20 -
 21
21 -
 22
22 -
 23
23 -
 24
24 -
 25
25 -
 26
26 -
 27
27 -
 28
28 -
 29
29 -
 30
30 -
 31
31 -
 32
32 -
 33
33 -
 34
34 -
 35
35 -
36
-
37
-
38
-
39
-
40
-
41
-
42
-
43
-
44
-
45
-
46
-
47
-
48
-
49
-
50
-
51
-
52
-
53
-
54
-
55
-
56
-
57
-
58
-
59
-
60
-
61
-
62
-
63
-
64
-
65
-
66
-
67
-
68
-
69
-
70
-
71
-
72
-
73
-
74
-
75
-
76
-
77
-
78
-
79
-
80
-
81
-
82
-
83
-
84
-
85
-
86
-
87
-
88
-
89
-
90
-
91
-
92
 |
 |

23
sales for many of these categories has been driven by the
migration of the capabilities of these products into
smartphones.
Target Mobile Centers
Sales in our Target Mobile centers segment increased
$84.1 million or 24.6% in 2012. This sales increase was
driven primarily by increased sales at our Target Mobile
centers in the first half of 2012, when compared with the
same period in 2011. This increase in Target Mobile center
sales was driven by the additional 646 Target Mobile
centers that were open for the full first six months of 2012
but were not open for the full first six months of 2011. In
October 2012, we exercised our contractual right to notify
Target of our intention to stop operating the Target Mobile
centers if we could not amend the current arrangement. An
acceptable arrangement was not negotiated; therefore, we
will exit this business by April 8, 2013.
Other Sales
Amounts in other sales reflect our business activities that
are not separately reportable, including sales to our
independent dealers, sales generated by our
www.radioshack.com website, and sales at our Mexican
subsidiary. Each of these business activities accounted for
less than 5% of our consolidated net sales and operating
revenues in 2012. Other sales were essentially flat for
2012, when compared with last year. Our sales increased
at our Mexican subsidiary due to new store openings, but
this increase was substantially offset by decreased sales to
our U.S. independent dealers. Additionally, we recognized
$3.0 million of franchise fee revenue in the third quarter
related to the opening of our first franchised stores in
Southeast Asia.
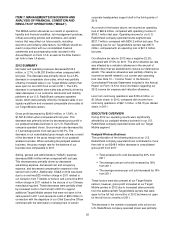
Gross Profit
Consolidated gross profit and gross margin are as follows:
Year Ended December 31,
(In millions) 2012
2011
2010
Gross profit $1,561.8
$1,810.8
$1,913.7
Gross profit (decrease) increase (13.8%)
(5.4%)
2.2%
Gross margin rate 36.7%
41.4%
44.9%
Consolidated gross profit and gross margin for 2012 were
$1,561.8 million and 36.7%, respectively, compared with
$1,810.8 million and 41.4%, respectively, in 2011, resulting
in a 13.8% decrease in gross profit dollars and a 4.7
percentage point decrease in our gross margin. These
decreases were primarily driven by decreased gross profit
of the postpaid wireless business in our U.S. RadioShack
company-operated stores.
The decrease in gross profit dollars of the postpaid wireless
business in our U.S. RadioShack company-operated stores
was the result of decreases in 2012 in the number of units
sold and in the average gross profit dollars per unit sold,
when compared with 2011. Average gross profit dollars per
unit sold decreased because our average cost per unit
increased from last year at a higher rate than the increase
in our average revenue per unit. The increase in average
cost per unit was driven by the change in our sales mix
towards higher cost smartphones such as the Apple iPhone
and Android-based smartphones.
The decrease in our consolidated gross margin rate was a
result of the decrease in the gross margin rate of the
postpaid wireless business in our U.S. RadioShack
company-operated stores and Target Mobile centers. The
decrease in the gross margin rate of our postpaid wireless
business was driven by a change in our sales mix towards
lower-margin smartphones and a decrease in the average
gross profit dollars per unit sold.
When excluding the postpaid wireless business, the gross
margin rate for the balance of our business was
comparable to 2011.