Panera Bread 2009 Annual Report Download - page 67
Download and view the complete annual report
Please find page 67 of the 2009 Panera Bread annual report below. You can navigate through the pages in the report by either clicking on the pages listed below, or by using the keyword search tool below to find specific information within the annual report.-
 1
1 -
2
-
3
-
4
-
5
-
6
-
7
-
8
-
9
-
10
-
11
-
12
-
13
-
14
-
15
-
16
-
17
-
18
-
19
-
20
-
21
-
22
-
23
-
24
-
25
-
26
-
27
-
28
-
29
-
30
-
31
-
32
-
33
-
34
-
35
-
36
-
37
-
38
-
39
-
40
-
41
-
42
-
43
-
44
-
45
-
46
-
47
-
48
-
49
-
50
-
51
-
52
-
53
-
54
-
55
-
56
-
 57
57 -
 58
58 -
 59
59 -
 60
60 -
 61
61 -
 62
62 -
 63
63 -
 64
64 -
 65
65 -
 66
66 -
 67
67 -
 68
68 -
 69
69 -
 70
70 -
 71
71 -
 72
72 -
 73
73 -
 74
74 -
 75
75 -
 76
76 -
 77
77 -
78
-
79
-
80
-
81
-
82
-
83
-
84
-
85
-
86
-
87
-
88
-
89
-
90
-
91
-
92
-
93
-
94
-
95
-
96
-
97
 |
 |

investment and their subsequent distribution of cash. The Company then utilized this assessment of the underlying
collateral from multiple indicators of fair value, which were then adjusted to reflect the expected timing of
disposition and market risks to arrive at an estimated fair value of the Columbia Portfolio units. During fiscal 2009,
the Company received $5.5 million of cash redemptions, which fully redeemed the Company’s remaining units in
the Columbia Portfolio. The Columbia Portfolio units had an estimated fair value of $0.650 per unit, or $4.1 million,
as of December 30, 2008, and $0.960 per unit, or $23.2 million, as of the date of adopting the fair value accounting
standard, December 26, 2007. Based on the valuation methodology used to determine the fair value, the Columbia
Portfolio was classified within Level 3 of the fair value hierarchy. Realized and unrealized gains/(losses) relating to
the Columbia Portfolio were classified in other (income) expense, net in the Consolidated Statements of Operations.
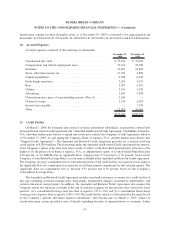
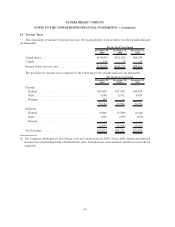
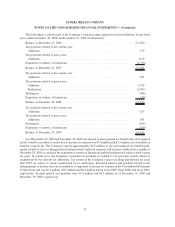
The following table sets forth a summary of the changes in the fair value of the Company’s Level 3 financial asset
for the periods indicated (in thousands):
December 29,
2009
December 30,
2008
For the Fiscal Year Ended
Beginning balance ..................................... $4,126 $23,198
Net realized and unrealized gains (losses)(1) .................. 1,339 (1,910)
Redemptions ......................................... (5,465) (17,162)
Ending balance ....................................... $ — $ 4,126
(1) Includes $2.0 million of losses attributable to the change in unrealized losses relating to the units of the
Columbia Portfolio still held as of December 30, 2008.
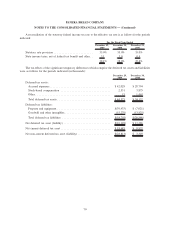
6. Inventories
Inventories consisted of the following (in thousands):
December 29,
2009
December 30,
2008
Food:
Fresh dough facilities:
Rawmaterials........................................ $ 2,573 $ 3,040
Finished goods ....................................... 275 319
Bakery-cafes:
Rawmaterials........................................ 7,304 6,533
Paper goods ............................................. 2,143 2,021
Retail merchandise ........................................ — 46
$12,295 $11,959
61
PANERA BREAD COMPANY
NOTES TO THE CONSOLIDATED FINANCIAL STATEMENTS — (Continued)