Panera Bread 2009 Annual Report Download - page 34
Download and view the complete annual report
Please find page 34 of the 2009 Panera Bread annual report below. You can navigate through the pages in the report by either clicking on the pages listed below, or by using the keyword search tool below to find specific information within the annual report.-
 1
1 -
2
-
3
-
4
-
5
-
6
-
7
-
8
-
9
-
10
-
11
-
12
-
13
-
14
-
15
-
16
-
17
-
18
-
19
-
20
-
21
-
22
-
23
-
 24
24 -
 25
25 -
 26
26 -
 27
27 -
 28
28 -
 29
29 -
 30
30 -
 31
31 -
 32
32 -
 33
33 -
 34
34 -
 35
35 -
 36
36 -
 37
37 -
 38
38 -
 39
39 -
 40
40 -
 41
41 -
 42
42 -
 43
43 -
 44
44 -
45
-
46
-
47
-
48
-
49
-
50
-
51
-
52
-
53
-
54
-
55
-
56
-
57
-
58
-
59
-
60
-
61
-
62
-
63
-
64
-
65
-
66
-
67
-
68
-
69
-
70
-
71
-
72
-
73
-
74
-
75
-
76
-
77
-
78
-
79
-
80
-
81
-
82
-
83
-
84
-
85
-
86
-
87
-
88
-
89
-
90
-
91
-
92
-
93
-
94
-
95
-
96
-
97
 |
 |
or before specific dates. If a franchisee fails to develop bakery-cafes on schedule, we have the right to terminate the
ADA and develop Company-owned locations or develop locations through new area developers in that market. We
may exercise one or more alternative remedies to address defaults by area developers, including not only
development defaults, but also defaults in complying with our operating and brand standards and other covenants
under the ADAs and franchise agreements. We may waive compliance with certain requirements under its ADAs
and franchise agreements if we determine that such action is warranted under the particular circumstances.
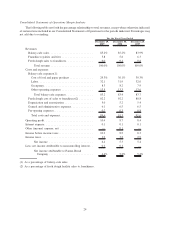
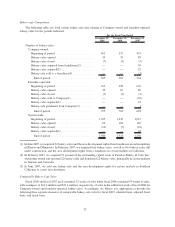
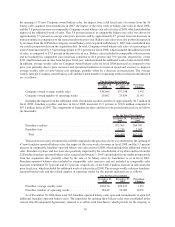
Fresh dough sales to franchisees in fiscal 2009 increased 3.5 percent to $121.9 million compared to
$117.8 million in fiscal 2008, which included the impact from the additional week of fresh dough sales to
franchisees of approximately $2.2 million in fiscal 2008. The increase in fresh dough sales to franchisees was
primarily driven by the previously described increased number of franchise-operated bakery-cafes opened since the
prior fiscal year and due to the year-over-year roll in of increases in our sales prices of dough products to franchisees
taken in the second half of fiscal 2008, partially offset by the closure of seven franchise-operated bakery-cafes.
Costs and Expenses
The cost of food and paper products includes the costs associated with the fresh dough operations that sell fresh
dough products to Company-owned bakery-cafes, as well as the cost of food and paper products supplied by third-
party vendors and distributors. The costs associated with the fresh dough operations that sell fresh dough products to
franchise-operated bakery-cafes are excluded and are shown separately as fresh dough cost of sales to franchisees in
the Consolidated Statements of Operations.
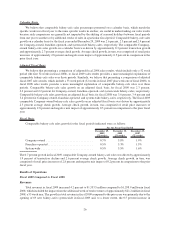
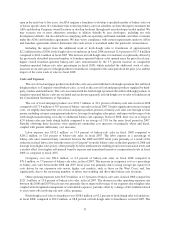
The cost of food and paper products was $337.6 million, or 29.3 percent of bakery-cafe sales in fiscal 2009
compared to $332.7 million, or 30.1 percent of bakery-cafe sales, in fiscal 2008. This decrease in the cost of food
and paper products as a percentage of bakery-cafe sales was principally due to decreases in certain commodity
costs, including wheat and fuel; category management initiatives such as product mix management and pricing
strategy; cost savings in procurement; and improved leverage of our fresh dough manufacturing costs due to
additional bakery-cafe openings. In fiscal 2009, there was an average of 62.5 bakery-cafes per fresh dough facility
compared to an average of 62.0 in fiscal 2008.
Labor expense was $370.6 million, or 32.1 percent of bakery-cafe sales, in fiscal 2009 compared to
$352.5 million, or 31.9 percent of bakery-cafe sales, in fiscal 2008. The increase in labor expense as a percentage
of bakery-cafe sales was primarily due to increasing medical costs and our investment in staffing for certain
sampling events.
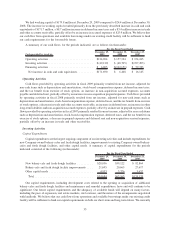
Occupancy cost was $96.0 million, or 8.3 percent of bakery-cafe sales, in fiscal 2009 compared to
$90.4 million, or 8.2 percent of bakery-cafe sales, in fiscal 2008. The modest increase in occupancy cost as a
percentage of bakery-cafe sales was primarily due to increases in real estate taxes and common area maintenance
costs and a $0.3 million charge in fiscal 2009 related to the closure of two bakery-cafes.
Other operating expenses were $155.4 million, or 13.5 percent of bakery-cafe sales, in fiscal 2009 compared to
$147.0 million, or 13.3 percent of bakery-cafe sales, in fiscal 2008. The increase in other operating expenses as a
percentage of bakery-cafe sales was primarily due to a charge for the write-off of smallwares and equipment related
to the rollout of new china and panini grills of approximately $1.2 million, a charge of $1.1 million related to the
write-off of assets as a result of the closure of three bakery-cafes, and a charge of $0.6 million related to the
impairment of one bakery-cafe. Fiscal 2008 results included a charge of $0.4 million related to asset write-offs
involving our new coffee program.
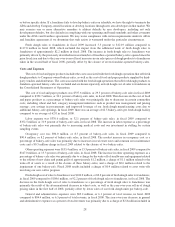
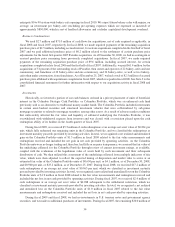
Fresh dough cost of sales to franchisees was $100.2 million, or 82.2 percent of fresh dough sales to franchisees,
in fiscal 2009 compared to $108.6 million, or 92.2 percent of fresh dough sales to franchisees, in fiscal 2008. The
decrease in the fresh dough cost of sales to franchisees as a percentage of fresh dough sales to franchisees was
primarily the result of the aforementioned decrease in wheat costs, as well as the year-over-year roll-in of dough
pricing taken in the first half of 2008, partially offset by lower sales of our fresh dough units per bakery-cafe.
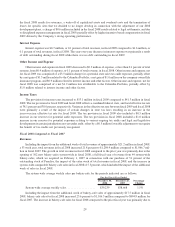
General and administrative expenses were $83.2 million, or 6.1 percent of total revenue, in fiscal 2009
compared to $84.4 million, or 6.5 percent of total revenue, in fiscal 2008. The year-over-year decrease in general
and administrative expenses as a percent of total revenues was primarily due to a charge of $2.8 million included in
28