Panera Bread 2009 Annual Report Download - page 36
Download and view the complete annual report
Please find page 36 of the 2009 Panera Bread annual report below. You can navigate through the pages in the report by either clicking on the pages listed below, or by using the keyword search tool below to find specific information within the annual report.-
 1
1 -
2
-
3
-
4
-
5
-
6
-
7
-
8
-
9
-
10
-
11
-
12
-
13
-
14
-
15
-
16
-
17
-
18
-
19
-
20
-
21
-
22
-
23
-
24
-
25
-
 26
26 -
 27
27 -
 28
28 -
 29
29 -
 30
30 -
 31
31 -
 32
32 -
 33
33 -
 34
34 -
 35
35 -
 36
36 -
 37
37 -
 38
38 -
 39
39 -
 40
40 -
 41
41 -
 42
42 -
 43
43 -
 44
44 -
 45
45 -
 46
46 -
47
-
48
-
49
-
50
-
51
-
52
-
53
-
54
-
55
-
56
-
57
-
58
-
59
-
60
-
61
-
62
-
63
-
64
-
65
-
66
-
67
-
68
-
69
-
70
-
71
-
72
-
73
-
74
-
75
-
76
-
77
-
78
-
79
-
80
-
81
-
82
-
83
-
84
-
85
-
86
-
87
-
88
-
89
-
90
-
91
-
92
-
93
-
94
-
95
-
96
-
97
 |
 |

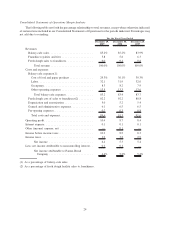
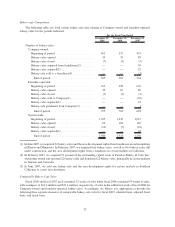
the opening of 35 new Company-owned bakery-cafes, the impact from a full fiscal year of revenue from the 36
bakery-cafes acquired from franchisees in 2007, the impact of the extra week of bakery-cafe sales in fiscal 2008,
and the 5.8 percent increase in comparable Company-owned bakery-cafe sales for fiscal 2008, which included the
impact of the additional week of sales. This 5.8 percent increase in comparable bakery-cafe sales was driven by
approximately 5.1 percent in average sales price increases and by approximately 0.7 percent from net increases in
transaction/mix in comparison to the same period in the prior year. Bakery-cafe sales were also positively impacted
by revenues from the 22 Paradise company-owned bakery-cafes acquired on February 1, 2007 and consolidated into
our results prospectively from the acquisition date. In total, Company-owned bakery-cafe sales as a percentage of
total revenue increased by 1.3 percentage points to 85.2 percent for fiscal 2008, which included the additional week
of sales, as compared to 83.9 percent in the prior fiscal year. Bakery-cafes included in comparable sales increases
and not included in comparable sales increases consisted of 20.4 percent and 79.6 percent, respectively, of the
$211.4 million increase in sales from the prior fiscal year, which included the additional week of sales in fiscal 2008.
In addition, average weekly sales for Company-owned bakery-cafes for fiscal 2008 increased as compared to the
prior year primarily due to price increases and operational initiatives focused on speed and accuracy to improve
average weekly sales for new bakery-cafe openings, partially offset by a decrease in transactions. The average
weekly sales per Company-owned bakery-cafe and the related number of operating weeks for the periods indicated
are as follows:
December 30,
2008
December 25,
2007
Percentage
Change
For the Fiscal Year Ended
Company-owned average weekly sales ................ $38,066 $37,548 1.4%
Company-owned number of operating weeks ........... 29,062 23,834 21.9%
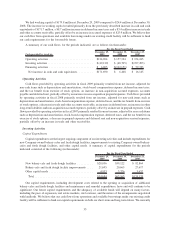
Including the impact from the additional week of franchise royalties and fees of approximately $1.5 million in
fiscal 2008, franchise royalties and fees in fiscal 2008 increased 11.3 percent to $74.8 million compared to
$67.2 million in fiscal 2007. The components of franchise royalties and fees for the periods indicated are as follows
(in thousands):
December 30,
2008
December 25,
2007
For the Fiscal Year Ended
Franchise royalties ........................................ $72,565 $64,581
Franchise fees ........................................... 2,235 2,607
Total ................................................ $74,800 $67,188
The increase in royalty revenue in fiscal 2008 compared to the prior fiscal year was attributed to the opening of
67 new franchise-operated bakery-cafes, the impact of the extra week of revenue in fiscal 2008, and the 5.3 percent
increase in comparable franchise-operated bakery-cafe sales in fiscal 2008, which included the additional week of
sales. Franchise royalties and fees were also positively impacted by the consolidation of royalties and fees from the
22 Paradise franchise-operated bakery-cafes acquired on February 1, 2007 and included in our results prospectively
from the acquisition date, partially offset by the sale of 36 bakery-cafes by franchisees to us in fiscal 2007.
Franchise-operated bakery-cafes included in comparable sales increases and not included in comparable sales
increases contributed 38.7 percent and 61.3 percent, respectively, of the $166.4 million increase in sales from the
prior fiscal year, which included the additional week of sales in fiscal 2008. The average weekly sales per franchise-
operated bakery-cafe and the related number of operating weeks for the periods indicated are as follows:
December 30,
2008
December 25,
2007
Percentage
Change
For the Fiscal Year Ended
Franchise average weekly sales ..................... $40,126 $39,433 1.8%
Franchise number of operating weeks ................ 38,449 34,905 10.2%
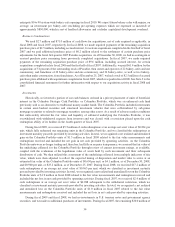
As of December 30, 2008, there were 763 franchise-operated bakery-cafes open and commitments to open 265
additional franchise-operated bakery-cafes. The timetables for opening these bakery-cafes were established in the
various Area Development Agreements, referred to as ADAs with franchisees, which provide for the majority to
30