Panera Bread 2009 Annual Report Download - page 33
Download and view the complete annual report
Please find page 33 of the 2009 Panera Bread annual report below. You can navigate through the pages in the report by either clicking on the pages listed below, or by using the keyword search tool below to find specific information within the annual report.-
 1
1 -
2
-
3
-
4
-
5
-
6
-
7
-
8
-
9
-
10
-
11
-
12
-
13
-
14
-
15
-
16
-
17
-
18
-
19
-
20
-
21
-
22
-
 23
23 -
 24
24 -
 25
25 -
 26
26 -
 27
27 -
 28
28 -
 29
29 -
 30
30 -
 31
31 -
 32
32 -
 33
33 -
 34
34 -
 35
35 -
 36
36 -
 37
37 -
 38
38 -
 39
39 -
 40
40 -
 41
41 -
 42
42 -
 43
43 -
44
-
45
-
46
-
47
-
48
-
49
-
50
-
51
-
52
-
53
-
54
-
55
-
56
-
57
-
58
-
59
-
60
-
61
-
62
-
63
-
64
-
65
-
66
-
67
-
68
-
69
-
70
-
71
-
72
-
73
-
74
-
75
-
76
-
77
-
78
-
79
-
80
-
81
-
82
-
83
-
84
-
85
-
86
-
87
-
88
-
89
-
90
-
91
-
92
-
93
-
94
-
95
-
96
-
97
 |
 |

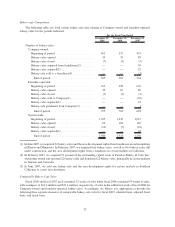
system-wide comparable bakery-cafe sales in fiscal 2009, which included the impact of the additional week of sales
in fiscal 2008, partially offset by the closure of 14 bakery-cafes system-wide in fiscal 2009.
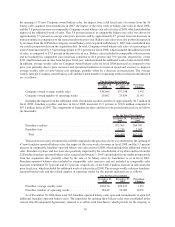
The system-wide average weekly sales per bakery-cafe for the periods indicated are as follows:
December 29,
2009
December 30,
2008
Percentage
Change
For the Fiscal Year Ended
System-wide average weekly sales................... $39,926 $39,239 1.8%
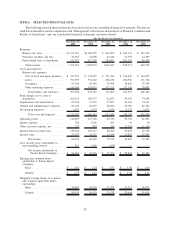
Bakery-cafe sales in fiscal 2009 increased 4.2 percent to $1,153.3 million compared to $1,106.3 million in
fiscal 2008, which included the impact from the additional week of bakery-cafe sales of approximately $17.5 mil-
lion in fiscal 2008. The increase in bakery-cafe sales in fiscal 2009 compared to the prior fiscal year was primarily
due to the opening of 30 new Company-owned bakery-cafes and, to a lesser extent, the previously described
0.7 percent increase in comparable Company-owned bakery-cafe sales in fiscal 2009, which included the impact of
the additional week of sales in fiscal 2008, partially offset by the closure of seven Company-owned bakery-cafes. In
total, Company-owned bakery-cafe sales as a percentage of total revenue remained consistent at 85.2 percent in
both fiscal 2009 and fiscal 2008. In addition, the increase in average weekly sales for Company-owned bakery-cafes
in fiscal 2009 compared to the prior fiscal year was primarily due to the previously described average check growth
that resulted from our initiative to drive add-on sales and our category management initiative. The average weekly
sales per Company-owned bakery-cafe and the related number of operating weeks for the periods indicated are as
follows:
December 29,
2009
December 30,
2008
Percentage
Change
For the Fiscal Year Ended
Company-owned average weekly sales ................ $39,050 $38,066 2.6%
Company-owned number of operating weeks ........... 29,533 29,062 1.6%
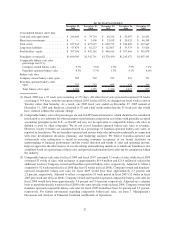
Franchise royalties and fees in fiscal 2009 increased 4.8 percent to $78.4 million compared to $74.8 million in
fiscal 2008, which included the impact from the additional week of franchise royalties and fees of approximately
$1.5 million in fiscal 2008. The components of franchise royalties and fees for the periods indicated are as follows
(in thousands):
December 29,
2009
December 30,
2008
For the Fiscal Year Ended
Franchise royalties ........................................ $77,119 $72,565
Franchise fees ........................................... 1,248 2,235
Total ................................................ $78,367 $74,800
The increase in franchise royalty and fee revenue in fiscal 2009 compared to the prior fiscal year was attributed
to the opening of 39 new franchise-operated bakery-cafes and, to a lesser extent, the 0.5 percent increase in
comparable franchise-operated bakery-cafe sales in fiscal 2009, which included the additional week of sales in
fiscal 2008, partially offset by the closure of seven franchise-operated bakery-cafes. The average weekly sales per
franchise-operated bakery-cafe and the related number of operating weeks for the periods indicated are as follows:
December 29,
2009
December 30,
2008
Percentage
Change
For the Fiscal Year Ended
Franchise average weekly sales ..................... $40,566 $40,126 1.1%
Franchise number of operating weeks ................ 40,436 38,449 5.2%
As of December 29, 2009, there were 795 franchise-operated bakery-cafes open and commitments to open 240
additional franchise-operated bakery-cafes. The timetables for opening these bakery-cafes are established in the
various Area Development Agreements, referred to as ADAs, with franchisees, which provide for the majority to
open in the next four to five years. An ADA requires a franchisee to develop a specified number of bakery-cafes on
27