Panera Bread 2009 Annual Report Download - page 27
Download and view the complete annual report
Please find page 27 of the 2009 Panera Bread annual report below. You can navigate through the pages in the report by either clicking on the pages listed below, or by using the keyword search tool below to find specific information within the annual report.-
 1
1 -
2
-
3
-
4
-
5
-
6
-
7
-
8
-
9
-
10
-
11
-
12
-
13
-
14
-
15
-
16
-
 17
17 -
 18
18 -
 19
19 -
 20
20 -
 21
21 -
 22
22 -
 23
23 -
 24
24 -
 25
25 -
 26
26 -
 27
27 -
 28
28 -
 29
29 -
 30
30 -
 31
31 -
 32
32 -
 33
33 -
 34
34 -
 35
35 -
 36
36 -
 37
37 -
38
-
39
-
40
-
41
-
42
-
43
-
44
-
45
-
46
-
47
-
48
-
49
-
50
-
51
-
52
-
53
-
54
-
55
-
56
-
57
-
58
-
59
-
60
-
61
-
62
-
63
-
64
-
65
-
66
-
67
-
68
-
69
-
70
-
71
-
72
-
73
-
74
-
75
-
76
-
77
-
78
-
79
-
80
-
81
-
82
-
83
-
84
-
85
-
86
-
87
-
88
-
89
-
90
-
91
-
92
-
93
-
94
-
95
-
96
-
97
 |
 |

December 29,
2009
December 30,
2008
December 25,
2007
December 26,
2006
December 27,
2005
For the Fiscal Year Ended(1)
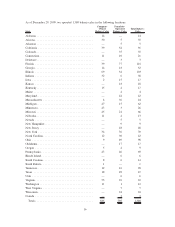
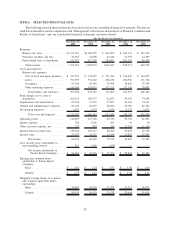
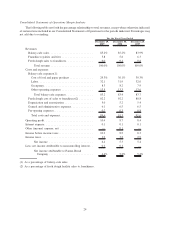
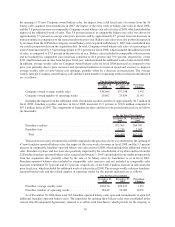
Consolidated balance sheet data:
Cash and cash equivalents ......... $ 246,400 $ 74,710 $ 68,242 $ 52,097 $ 24,451
Short-term investments . . . ......... $ — $ 2,400 $ 23,198 $ 20,025 $ 46,308
Total assets . ................... $ 837,165 $ 673,917 $ 698,752 $ 542,609 $ 437,667
Long-term liabilities .............. $ 97,870 $ 61,217 $ 122,807 $ 35,333 $ 33,824
Stockholders’ equity.............. $ 597,036 $ 495,162 $ 446,164 $ 397,666 $ 316,978
Franchisee revenues(2) . . . ......... $1,640,309 $1,542,791 $1,376,430 $1,245,472 $1,097,191
Comparable bakery-cafe sales
percentage for(2)(3):
Company-owned bakery-cafes . . . . . 0.7% 5.8% 1.9% 3.9% 7.4%
Franchise-operated bakery-cafes . . . 0.5% 5.3% 1.5% 4.1% 8.0%
Bakery-cafe data:
Company-owned bakery-cafes open . . . 585 562 532 391 311
Franchise-operated bakery-cafes
open ....................... 795 763 698 636 566
Total bakery-cafes open ......... 1,380 1,325 1,230 1,027 877
(1) Fiscal 2008 was a 53 week year consisting of 371 days. All other fiscal years presented contained 52 weeks
consisting of 364 days, with the exception of fiscal 2005. In fiscal 2005, we changed our fiscal week to end on
Tuesday rather than Saturday. As a result, our 2005 fiscal year ended on December 27, 2005 instead of
December 31, 2005 and, therefore, consisted of 52 and a half weeks rather than the 53 week year that would
have resulted without the calendar change.
(2) Comparable bakery-cafe sales percentages are non-GAAP financial measures, which should not be considered
in isolation or as a substitute for other measures of performance prepared in accordance with generally accepted
accounting principles in the U.S., or GAAP, and may not be equivalent to comparable bakery-cafe sales as
defined or used by other companies. We do not record franchise-operated bakery-cafe sales as revenues.
However, royalty revenues are calculated based on a percentage of franchise-operated bakery-cafe sales, as
reported by franchisees. We use franchise-operated and system-wide sales information internally in connection
with store development decisions, planning, and budgeting analyses. We believe franchise-operated and
system-wide sales information is useful in assessing consumer acceptance of our brand, facilitates an
understanding of financial performance and the overall direction and trends of sales and operating income,
helps us appreciate the effectiveness of our advertising and marketing initiatives to which our franchisees also
contribute based on a percentage of their sales, and provides information that is relevant for comparison within
the industry.
(3) Comparable bakery-cafe sales for fiscal 2009 and fiscal 2007 contained 52 weeks of sales while fiscal 2008
contained 53 weeks of sales, with an impact of approximately $14.4 million and $21.4 million of sales in the
additional week for Company-owned and franchise-operated bakery-cafes, respectively. Adjusted to reflect a
comparative 52 week period in fiscal 2008 (the first 52 weeks in fiscal 2008), Company-owned and franchise-
operated comparable bakery-cafe sales for fiscal 2009 would have been approximately 2.3 percent and
2.2 percent, respectively. Adjusted to reflect a comparative 53 week period in fiscal 2007 (52 weeks in fiscal
2007 plus week one of fiscal 2008), Company-owned and franchise-operated comparable bakery-cafe sales for
fiscal 2008 would have been approximately 3.6 percent and 3.4 percent, respectively. Adjusted on a calendar
basis to match the specific weeks in fiscal 2009 to the same specific weeks in fiscal 2008, Company-owned and
franchise-operated comparable bakery-cafe sales for fiscal 2009 would have been 2.6 percent and 2.3 percent,
respectively. For further information regarding comparable bakery-cafe sales, see Item 7. Management’s
Discussion and Analysis of Financial Condition and Results of Operations.
21