Panera Bread 2009 Annual Report Download - page 32
Download and view the complete annual report
Please find page 32 of the 2009 Panera Bread annual report below. You can navigate through the pages in the report by either clicking on the pages listed below, or by using the keyword search tool below to find specific information within the annual report.-
 1
1 -
2
-
3
-
4
-
5
-
6
-
7
-
8
-
9
-
10
-
11
-
12
-
13
-
14
-
15
-
16
-
17
-
18
-
19
-
20
-
21
-
 22
22 -
 23
23 -
 24
24 -
 25
25 -
 26
26 -
 27
27 -
 28
28 -
 29
29 -
 30
30 -
 31
31 -
 32
32 -
 33
33 -
 34
34 -
 35
35 -
 36
36 -
 37
37 -
 38
38 -
 39
39 -
 40
40 -
 41
41 -
 42
42 -
43
-
44
-
45
-
46
-
47
-
48
-
49
-
50
-
51
-
52
-
53
-
54
-
55
-
56
-
57
-
58
-
59
-
60
-
61
-
62
-
63
-
64
-
65
-
66
-
67
-
68
-
69
-
70
-
71
-
72
-
73
-
74
-
75
-
76
-
77
-
78
-
79
-
80
-
81
-
82
-
83
-
84
-
85
-
86
-
87
-
88
-
89
-
90
-
91
-
92
-
93
-
94
-
95
-
96
-
97
 |
 |

Calendar Basis
We believe that comparable bakery-cafe sales percentages presented on a calendar basis, which match the
specific weeks in a fiscal year to the same specific weeks in another, are useful in understanding our sales results
because such comparisons are generally not impacted by the shifting of seasonal holidays between fiscal periods
from one year to another or by additional weeks of sales in a particular fiscal period. Comparable bakery-cafe sales
growth on a calendar basis for the fiscal year ended December 29, 2009 was 2.6 percent, 2.3 percent and 2.4 percent
for Company-owned, franchise-operated, and system-wide bakery-cafes, respectively. The comparable Company-
owned bakery-cafe sales growth on a calendar basis was driven by approximately 0.3 percent transaction growth
and approximately 2.3 percent average check growth. Average check growth, in turn, was comprised of retail price
increases of approximately 2.8 percent and negative mix impact of approximately 0.5 percent in comparison to the
prior fiscal year.
Adjusted Fiscal Basis
We believe that presenting a comparison of adjusted fiscal 2008 sales results, which include only a 52 week
period (the first 52 weeks in fiscal 2008), to fiscal 2009 sales results provides a more meaningful explanation of
comparable bakery-cafe sales over those periods. Similarly, we believe that presenting a comparison of adjusted
fiscal 2007 sales results, which include a 53 week period (52 weeks in fiscal 2007 plus week one of fiscal 2008), to
fiscal 2008 sales results provides a more meaningful explanation of comparable bakery-cafe sales over those
periods. Comparable bakery-cafe sales growth on an adjusted fiscal basis for fiscal 2009 was 2.3 percent,
2.2 percent and 2.2 percent for Company-owned, franchise-operated, and system-wide bakery-cafes, respectively.
Comparable bakery-cafe sales growth on an adjusted fiscal basis for fiscal 2008 was 3.6 percent, 3.4 percent and
3.4 percent for Company-owned, franchise-operated, and system-wide bakery-cafes, respectively. The fiscal 2009
comparable Company-owned bakery-cafe sales growth on an adjusted fiscal basis was driven by approximately
2.3 percent average check growth. Average check growth, in turn, was comprised of retail price increases of
approximately 2.8 percent and negative mix impact of approximately 0.5 percent in comparison to the prior fiscal
year.
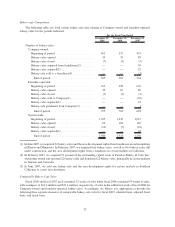
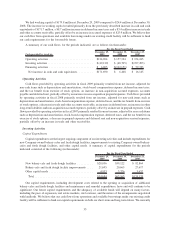
Fiscal Basis
Comparable bakery-cafe sales growth for the fiscal periods indicated were as follows:
December 29,
2009
(52 weeks)
December 30,
2008
(53 weeks)
December 25,
2007
(52 weeks)
For the Fiscal Year Ended
Company-owned .............................. 0.7% 5.8% 1.9%
Franchise-operated............................. 0.5% 5.3% 1.5%
System-wide ................................. 0.5% 5.5% 1.6%
The 0.7 percent growth in fiscal 2009 comparable Company-owned bakery-cafe sales was driven by approximately
1.9 percent of transaction decline and 2.6 percent average check growth. Average check growth, in turn, was
comprised of retail price increases of 2.8 percent and negative mix impact of 0.2 percent in comparison to the prior
fiscal year.
Results of Operations
Fiscal 2009 Compared to Fiscal 2008
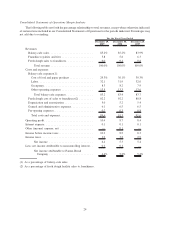
Revenues
Total revenues in fiscal 2009 increased 4.2 percent to $1,353.5 million compared to $1,298.9 million in fiscal
2008, which included the impact from the additional week of total revenues of approximately $21.2 million in fiscal
2008, a 53 week year. The growth in total revenue in fiscal 2009 compared to the prior year was primarily due to the
opening of 69 new bakery-cafes system-wide in fiscal 2009 and, to a lesser extent, the 0.5 percent increase in
26