Panera Bread 2009 Annual Report Download - page 35
Download and view the complete annual report
Please find page 35 of the 2009 Panera Bread annual report below. You can navigate through the pages in the report by either clicking on the pages listed below, or by using the keyword search tool below to find specific information within the annual report.-
 1
1 -
2
-
3
-
4
-
5
-
6
-
7
-
8
-
9
-
10
-
11
-
12
-
13
-
14
-
15
-
16
-
17
-
18
-
19
-
20
-
21
-
22
-
23
-
24
-
 25
25 -
 26
26 -
 27
27 -
 28
28 -
 29
29 -
 30
30 -
 31
31 -
 32
32 -
 33
33 -
 34
34 -
 35
35 -
 36
36 -
 37
37 -
 38
38 -
 39
39 -
 40
40 -
 41
41 -
 42
42 -
 43
43 -
 44
44 -
 45
45 -
46
-
47
-
48
-
49
-
50
-
51
-
52
-
53
-
54
-
55
-
56
-
57
-
58
-
59
-
60
-
61
-
62
-
63
-
64
-
65
-
66
-
67
-
68
-
69
-
70
-
71
-
72
-
73
-
74
-
75
-
76
-
77
-
78
-
79
-
80
-
81
-
82
-
83
-
84
-
85
-
86
-
87
-
88
-
89
-
90
-
91
-
92
-
93
-
94
-
95
-
96
-
97
 |
 |

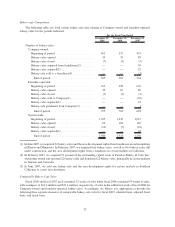
the fiscal 2008 results for severance, a write-off of capitalized assets and overhead costs and the termination of
leases for specific sites that we decided to no longer develop in connection with the adjustment of our 2008
development plans, a charge of $0.6 million included in the fiscal 2008 results related to legal settlements, and due
to disciplined expense management in fiscal 2009, partially offset by higher incentive based compensation in fiscal
2009 driven by the Company’s strong operating performance.
Interest Expense
Interest expense was $0.7 million, or 0.1 percent of total revenues, in fiscal 2009 compared to $1.6 million, or
0.1 percent of total revenues, in fiscal 2008. The year-over-year decrease in interest expense was primarily a result
of debt outstanding during fiscal 2008 while there was no debt outstanding in fiscal 2009.
Other Income and Expense
Other income and expense in fiscal 2009 decreased to $0.3 million of expense, or less than 0.1 percent of total
revenue, from $0.9 million of expense, or 0.1 percent of total revenue, in fiscal 2008. Other income and expense, net
for fiscal 2009 was comprised of a $3.5 million charge for a potential state sales tax audit exposure, partially offset
by a net gain of $1.3 million related to the Columbia Portfolio, a net gain of $1.0 million on the company-owned life
insurance program, and $0.9 million related to interest income and other factors. Other income and expense, net for
fiscal 2008 was comprised of a net $1.9 million loss attributable to the Columbia Portfolio, partially offset by
$1.0 million related to interest income and other factors.
Income Taxes
The provision for income taxes increased to $53.1 million in fiscal 2009 compared to $41.3 million in fiscal
2008. The tax provision for fiscal 2009 and fiscal 2008 reflects a combined federal, state, and local effective tax rate
of 38.1 percent and 38.0 percent, respectively. Variances in the effective tax rate between fiscal 2009 and fiscal 2008
were primarily a result of the impact of certain changes in state tax laws resulting in an increase in the
year-over-year effective tax rate for fiscal 2009. The tax provision in fiscal 2009 also included a $0.3 million
increase in our reserves for potential audit exposures. The tax provision in fiscal 2008 included a $1.0 million
increase in our reserves for potential exposures relating to various ongoing tax audits and legal and legislative
developments in certain jurisdictions not yet under audit, offset by a $0.5 million favorable adjustment to recognize
the benefit of tax credits not previously recognized.
Fiscal 2008 Compared to Fiscal 2007
Revenues
Including the impact from the additional week of total revenues of approximately $21.2 million in fiscal 2008,
a 53 week year, total revenues in fiscal 2008 increased 21.8 percent to $1,298.9 million compared to $1,066.7 mil-
lion in fiscal 2007. The growth in total revenue in fiscal 2008 compared to the prior year was primarily due to the
opening of 102 new bakery-cafes system-wide in fiscal 2008, a full fiscal year of revenue from 44 system-wide
bakery-cafes, which we acquired on February 1, 2007 in connection with our purchase of 51 percent of the
outstanding stock of Paradise, the impact of the extra week of total revenues in fiscal 2008, and the increase in
system-wide comparable bakery-cafe sales in fiscal 2008 of 5.5 percent, which included the impact of the additional
week of sales in fiscal 2008.
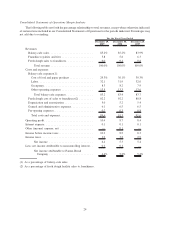
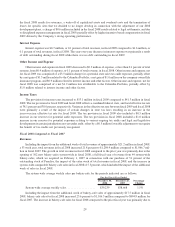
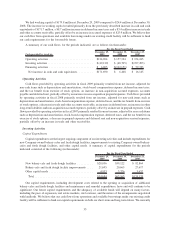
The system-wide average weekly sales per bakery-cafe for the periods indicated are as follows:
December 30,
2008
December 25,
2007
Percentage
Change
For the Fiscal Year Ended
System-wide average weekly sales................... $39,239 $38,668 1.5%
Including the impact from the additional week of bakery-cafe sales of approximately $17.5 million in fiscal
2008, bakery-cafe sales for fiscal 2008 increased 23.6 percent to $1,106.3 million compared to $894.9 million for
fiscal 2007. The increase in bakery-cafe sales for fiscal 2008 compared to the prior fiscal year was primarily due to
29