Panera Bread 2006 Annual Report Download - page 67
Download and view the complete annual report
Please find page 67 of the 2006 Panera Bread annual report below. You can navigate through the pages in the report by either clicking on the pages listed below, or by using the keyword search tool below to find specific information within the annual report.-
 1
1 -
2
-
3
-
4
-
5
-
6
-
7
-
8
-
9
-
10
-
11
-
12
-
13
-
14
-
15
-
16
-
17
-
18
-
19
-
20
-
21
-
22
-
23
-
24
-
25
-
26
-
27
-
28
-
29
-
30
-
31
-
32
-
33
-
34
-
35
-
36
-
37
-
38
-
39
-
40
-
41
-
42
-
43
-
44
-
45
-
46
-
47
-
48
-
49
-
50
-
51
-
52
-
53
-
54
-
55
-
56
-
 57
57 -
 58
58 -
 59
59 -
 60
60 -
 61
61 -
 62
62 -
 63
63 -
 64
64 -
 65
65 -
 66
66 -
 67
67 -
 68
68 -
 69
69 -
 70
70 -
 71
71 -
 72
72 -
 73
73 -
 74
74 -
 75
75 -
 76
76
 |
 |

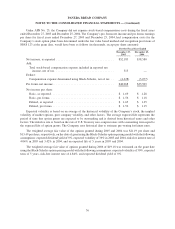
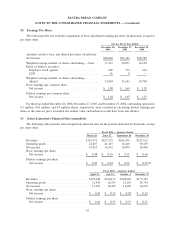
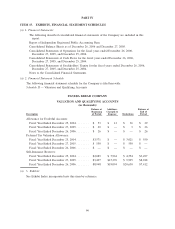
18. Earnings Per Share
The following table sets forth the computation of basic and diluted earnings per share (in thousands, except for
per share data):
December 26,
2006
December 27,
2005
December 25,
2004
For the Fiscal Year Ended
Amounts used for basic and diluted per share calculations:
Net income .................................... $58,849 $52,183 $38,580
Weighted average number of shares outstanding — basic . . 31,313 30,871 30,154
Effect of dilutive securities:
Employee stock options . ........................ 690 772 614
LTIP....................................... 41 8 —
Weighted average number of shares outstanding —
diluted ..................................... 32,044 31,651 30,768
Basic earnings per common share:
Net income .................................. $ 1.88 $ 1.69 $ 1.28
Diluted earnings per common share:
Net income .................................. $ 1.84 $ 1.65 $ 1.25
For the years ended December 26, 2006, December 27, 2005, and December 25, 2004, outstanding options for
0.3 million, 0.03 million, and 0.5 million shares, respectively, were excluded in calculating diluted earnings per
share as the exercise price exceeded fair market value and inclusion would have been anti-dilutive.
19. Selected Quarterly Financial Data (unaudited)
The following table presents selected quarterly financial data for the periods indicated (in thousands, except
per share data):
March 28 June 27 September 26 December 26
Fiscal 2006 — Quarters Ended
Revenues ............................ $193,971 $197,135 $204,954 $232,912
Operating profit ....................... 22,667 21,415 16,240 30,470
Net income .......................... 15,013 14,052 10,879 18,906
Basic earnings per share:
Net income ......................... $ 0.48 $ 0.45 $ 0.35 $ 0.60
Diluted earnings per share:
Net income ......................... $ 0.47 $ 0.44 $ 0.34 $ 0.59(2)
April 19 July 12 October 4 December 27
Fiscal 2005 — Quarters Ended
Revenues .............................. $178,148 $140,172 $148,626 $173,329
Operating profit ......................... 21,942 16,275 18,124 24,754
Net income ............................ 13,923 10,429 11,669 16,162
Basic earnings per share:
Net income .......................... $ 0.45 $ 0.34 $ 0.38 $ 0.52
Diluted earnings per share:
Net income .......................... $ 0.44 $ 0.33 $ 0.37 $ 0.51
62
PANERA BREAD COMPANY
NOTES TO THE CONSOLIDATED FINANCIAL STATEMENTS — (Continued)