Panera Bread 2006 Annual Report Download - page 23
Download and view the complete annual report
Please find page 23 of the 2006 Panera Bread annual report below. You can navigate through the pages in the report by either clicking on the pages listed below, or by using the keyword search tool below to find specific information within the annual report.-
 1
1 -
2
-
3
-
4
-
5
-
6
-
7
-
8
-
9
-
10
-
11
-
12
-
 13
13 -
 14
14 -
 15
15 -
 16
16 -
 17
17 -
 18
18 -
 19
19 -
 20
20 -
 21
21 -
 22
22 -
 23
23 -
 24
24 -
 25
25 -
 26
26 -
 27
27 -
 28
28 -
 29
29 -
 30
30 -
 31
31 -
 32
32 -
 33
33 -
34
-
35
-
36
-
37
-
38
-
39
-
40
-
41
-
42
-
43
-
44
-
45
-
46
-
47
-
48
-
49
-
50
-
51
-
52
-
53
-
54
-
55
-
56
-
57
-
58
-
59
-
60
-
61
-
62
-
63
-
64
-
65
-
66
-
67
-
68
-
69
-
70
-
71
-
72
-
73
-
74
-
75
-
76
 |
 |
In fiscal year 2005, we changed our fiscal week to end on Tuesday rather than Saturday, with our fiscal year
ending on the last Tuesday in December. This change allowed us to better serve customers by shifting the weekly
closing activities to a less busy day of the week. As a result, our 2005 fiscal year ended on December 27, 2005
instead of December 31, 2005 and, therefore, consisted of fifty-two and a half weeks rather than the fifty-three week
year that would have resulted without the calendar change. These additional three days in fiscal year 2005 did not
have a material impact on our financial statements. As a result of this calendar change, the next fifty-three week year
will occur in fiscal year 2008. Our fiscal year ended on the last Saturday in December for 2004 and prior fiscal years
and consisted of 13 four-week periods, with the first, second, and third quarters ending 16 weeks, 28 weeks, and
40 weeks, respectively, into the fiscal year.
We include in this report information on Company, franchisee, and/or system-wide comparable bakery-cafe
sales percentages and average weekly sales. System-wide sales is a non-GAAP financial measure that includes sales
from all Company-owned and franchise-operated bakery-cafes, as reported by franchisees. Management uses
system-wide sales information internally in connection with store development decisions, planning, and budgeting
analyses. Management believes it is useful in assessing consumer acceptance of our brand and facilitating an
understanding of financial performance as our franchisees pay royalties and contribute to advertising pools based on
a percentage of their sales.
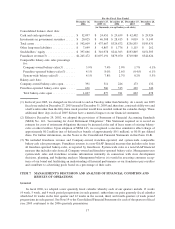
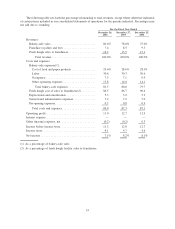
Our revenues are derived from Company-owned bakery-cafe sales, fresh dough sales to franchisees, and
franchise royalties and fees. Fresh dough sales to franchisees are primarily the sales of dough products to our
franchisees and the sales of tuna and cream cheese to certain franchisees. Franchise royalties and fees include
royalty income and fees from franchisees. The cost of food and paper products, labor, occupancy, and other
operating expenses relate primarily to Company-owned bakery-cafe sales. The fresh dough cost of sales to
franchisees relates primarily to the sale of fresh dough products and tuna and cream cheese to franchisees. General
and administrative, depreciation, and pre-opening expenses relate to all areas of revenue generation.
On February 1, 2007, we purchased 51 percent of the outstanding stock of Paradise Bakery & Café, Inc., which
we refer to as Paradise, owner and operator of 23 locations including 22 bakery-cafes, 17 of which are in the
Phoenix market, and one commissary, and franchisor of 23 locations including 22 bakery-cafes and one com-
missary, at a transaction value of $21.1 million. See Note 20 to the Consolidated Financial Statements in this
Form 10-K for further information with respect to the Paradise acquisition.
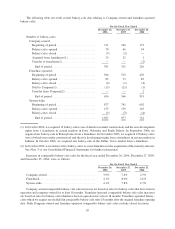
In fiscal year 2006, we earned $1.84 per diluted share with the following performance on key metrics: system-
wide comparable bakery-cafe sales growth of 4.1% (comparable bakery-cafe sales growth of 3.9% for Company-
owned bakery-cafes and 4.1% for franchise-operated bakery-cafes), system-wide average weekly sales increasing
2.2% to $39,150 ($37,833 for Company-owned bakery-cafes and $39,894 for franchise-operated bakery-cafes), and
155 new bakery-cafes opened system-wide, including 70 Company-owned bakery-cafes and 85 franchise-operated
bakery-cafes. The fiscal 2006 results of $1.84 per diluted share also included a charge of $0.03 per diluted share
related to the acquisition of Paradise. See Note 16 to the Consolidated Financial Statements in this Form 10-K for
further information with respect to this charge. In addition, for the fiscal year ended December 26, 2006, we
recognized $5.9 million in general and administrative expenses related to stock options as a result of our adoption on
December 28, 2005 of Statement of Financial Accounting Standards No. 123R, Share-Based Payment (or
SFAS 123R), which requires the recognition of the fair value of stock-based compensation. See Note 14 to the
Consolidated Financial Statements in this Form 10-K for further information on our stock based compensation.
In fiscal year 2005, we earned $1.65 per diluted share with the following system-wide performance on key
metrics: comparable bakery-cafe sales growth of 7.8% (comparable bakery-cafe sales growth of 7.4% for
Company-owned bakery cafes and 8.0% for franchise-operated bakery-cafes), system-wide average weekly sales
of $38,318 ($37,348 for Company-owned bakery-cafes and $38,777 for franchise-operated bakery-cafes), and 139
new bakery-cafes opened system-wide, including 66 Company-owned bakery-cafes and 73 franchise-operated
bakery-cafes. The fiscal 2005 results of $1.65 per diluted share excluded footnote stock option expense of $0.13 per
diluted share because SFAS 123R did not require the expensing of stock options in fiscal 2005. Earnings per diluted
share inclusive of footnote stock option expense would have been $1.52 per share for the year ended December 27,
2005. See “Reconciliation of Non-GAAP Measurements to GAAP Results” later in this section in this Form 10-K.
18