Panera Bread 2006 Annual Report Download - page 22
Download and view the complete annual report
Please find page 22 of the 2006 Panera Bread annual report below. You can navigate through the pages in the report by either clicking on the pages listed below, or by using the keyword search tool below to find specific information within the annual report.-
 1
1 -
2
-
3
-
4
-
5
-
6
-
7
-
8
-
9
-
10
-
11
-
 12
12 -
 13
13 -
 14
14 -
 15
15 -
 16
16 -
 17
17 -
 18
18 -
 19
19 -
 20
20 -
 21
21 -
 22
22 -
 23
23 -
 24
24 -
 25
25 -
 26
26 -
 27
27 -
 28
28 -
 29
29 -
 30
30 -
 31
31 -
 32
32 -
33
-
34
-
35
-
36
-
37
-
38
-
39
-
40
-
41
-
42
-
43
-
44
-
45
-
46
-
47
-
48
-
49
-
50
-
51
-
52
-
53
-
54
-
55
-
56
-
57
-
58
-
59
-
60
-
61
-
62
-
63
-
64
-
65
-
66
-
67
-
68
-
69
-
70
-
71
-
72
-
73
-
74
-
75
-
76
 |
 |

December 26,
2006
December 27,
2005 (1)
December 25,
2004
December 27,
2003
December 28,
2002
For the Fiscal Year Ended
(in thousands, except bakery-cafe data)
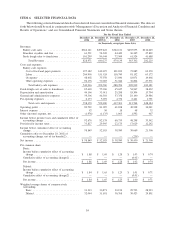
Consolidated balance sheet data:
Cash and cash equivalents .............. $ 52,097 $ 24,451 $ 29,639 $ 42,402 $ 29,924
Investments in government securities ...... $ 20,025 $ 46,308 $ 28,415 $ 9,019 $ 9,149
Total assets ......................... $ 542,609 $ 437,667 $324,672 $256,835 $195,431
Other long-term liabilities .............. $ 7,649 $ 4,867 $ 1,776 $ 1,115 $ 262
Stockholders’ equity .................. $ 397,666 $ 316,978 $241,363 $193,805 $151,503
Franchisee revenue(3) ................. $1,245,472 $1,097,191 $879,070 $710,980 $542,624
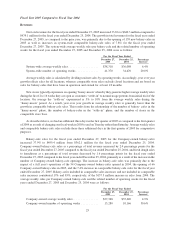
Comparable bakery-cafe sales percentage
for:
Company-owned bakery-cafes(3) ....... 3.9% 7.4% 2.9% 1.7% 4.1%
Franchise-operated bakery-cafes(3) ...... 4.1% 8.0% 2.6% (0.4)% 6.1%
System-wide bakery-cafes(3) .......... 4.1% 7.8% 2.7% 0.2% 5.5%
Bakery-cafe data:
Company-owned bakery-cafes open ....... 391 311 226 173 132
Franchise-operated bakery-cafes open ..... 636 566 515 429 346
Total bakery-cafes open .............. 1,027 877 741 602 478
(1) In fiscal year 2005, we changed our fiscal week to end on Tuesday rather than Saturday. As a result, our 2005
fiscal year ended on December 27, 2005 instead of December 31, 2005 and, therefore, consisted of fifty-two and
a half weeks rather than the fifty-three week year that would have resulted without the calendar change. These
additional three days in fiscal 2005 did not have a material impact on our financial statements.
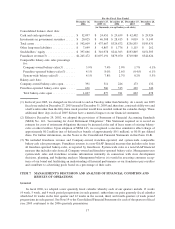
(2) Effective December 29, 2002, we adopted the provisions of Statement of Financial Accounting Standards
(SFAS) No. 143, “Accounting for Asset Retirement Obligations.” This Statement required us to record an
estimate for costs of retirement obligations that may be incurred at the end of lease terms of existing bakery-
cafes or other facilities. Upon adoption of SFAS 143, we recognized a one-time cumulative effect charge of
approximately $0.2 million (net of deferred tax benefit of approximately $0.1 million), or $0.01 per diluted
share. For further information, see the Notes to the Consolidated Financial Statements in this Form 10-K.
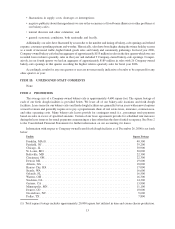
(3) We included franchisee revenue and Company-owned, franchise-operated, and system-wide comparable
bakery-cafe sales percentages. Franchisee revenue is a non-GAAP financial measure that includes sales from
all franchise-operated bakery-cafes, as reported by franchisees. System-wide sales is a non-GAAP financial
measure that includes sales from all Company-owned and franchise-operated bakery-cafes. Management uses
system-wide sales and franchisee revenue information internally in connection with store development
decisions, planning, and budgeting analyses. Management believes it is useful in assessing consumer accep-
tance of our brand and facilitating an understanding of financial performance as our franchisees pay royalties
and contribute to advertising pools based on a percentage of their sales.
ITEM 7. MANAGEMENT’S DISCUSSION AND ANALYSIS OF FINANCIAL CONDITION AND
RESULTS OF OPERATIONS
General
In fiscal 2006, we adopted a new quarterly fiscal calendar whereby each of our quarters include 13 weeks
(4 week, 5 week, and 4 week period progressions in each quarter), rather than our prior quarterly fiscal calendar
which had 16 weeks in the first quarter and 12 weeks in the second, third, and fourth quarters (4 week period
progressions in each quarter). See Note 19 to the Consolidated Financial Statements for each of the quarters of fiscal
year 2005 conformed to the 2006 quarterly presentation.
17