Panera Bread 2006 Annual Report Download - page 32
Download and view the complete annual report
Please find page 32 of the 2006 Panera Bread annual report below. You can navigate through the pages in the report by either clicking on the pages listed below, or by using the keyword search tool below to find specific information within the annual report.-
 1
1 -
2
-
3
-
4
-
5
-
6
-
7
-
8
-
9
-
10
-
11
-
12
-
13
-
14
-
15
-
16
-
17
-
18
-
19
-
20
-
21
-
 22
22 -
 23
23 -
 24
24 -
 25
25 -
 26
26 -
 27
27 -
 28
28 -
 29
29 -
 30
30 -
 31
31 -
 32
32 -
 33
33 -
 34
34 -
 35
35 -
 36
36 -
 37
37 -
 38
38 -
 39
39 -
 40
40 -
 41
41 -
 42
42 -
43
-
44
-
45
-
46
-
47
-
48
-
49
-
50
-
51
-
52
-
53
-
54
-
55
-
56
-
57
-
58
-
59
-
60
-
61
-
62
-
63
-
64
-
65
-
66
-
67
-
68
-
69
-
70
-
71
-
72
-
73
-
74
-
75
-
76
 |
 |
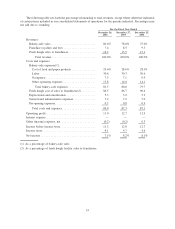
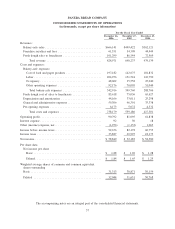
expense as a percentage of bakery-cafe sales decreased between the fiscal year ended December 27, 2005 and the
fiscal year ended December 25, 2004 primarily as a result of leveraging these costs over higher sales volumes,
partially offset by higher costs in the bakery-cafe bonus program.
For the fiscal year ended December 27, 2005, fresh dough facility cost of sales to franchisees was $75.0 million,
or 86.7% of fresh dough facility sales to franchisees, compared to $65.6 million, or 90.4% of fresh dough facility
sales to franchisees, for the fiscal year ended December 25, 2004. The decrease in the fresh dough facility cost of
sales rate in fiscal year 2005 was primarily due to lower ingredient costs. Butter costs in 2005 averaged $1.64 per
pound compared to $1.94 per pound in 2004.
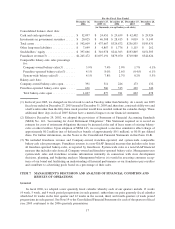
General and administrative expenses were $46.3 million, or 7.2% of total revenue, and $33.3 million, or 7.0%
of total revenue, for the fiscal years ended December 27, 2005 and December 25, 2004, respectively. The increase in
the general and administrative expense rate between 2005 and 2004 was primarily the result of increased incentive
compensation and marketing costs partially offset by the improved leveraging of these costs over higher revenue.
Other Income and Expense
Other income and expense for the fiscal year ended December 27, 2005 increased to $1.1 million of income, or
0.2% of total revenue, from $1.1 million of expense, or 0.3% of total revenue, for the fiscal year ended December 25,
2004. The increase in other income and expense results primarily from increased interest income in 2005 resulting
from both higher investment balances and higher interest rates.
Income Taxes
The provision for income taxes increased to $30.0 million for the fiscal year ended December 27, 2005
compared to $22.2 million for the fiscal year ended December 25, 2004. The tax provisions for the fiscal year ended
December 27, 2005 and December 25, 2004 reflected a consistent combined federal, state, and local effective tax
rate of 36.5%.
Net Income
Net income for the fiscal year ended December 27, 2005 increased $13.6 million, or 35%, to $52.2 million, or
$1.65 per diluted share, compared to net income of $38.6 million, or $1.25 per diluted share, for the fiscal year
ended December 25, 2004. The increase in net income in 2005 resulted from the factors described above.
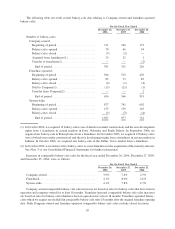
Liquidity and Capital Resources
Cash and cash equivalents were $52.1 million at December 26, 2006, compared with $24.5 million at
December 27, 2005. Our principal requirements for cash are capital expenditures for the development of new
Company-owned bakery-cafes, maintaining or remodeling existing Company-owned bakery-cafes, purchasing
existing franchise-operated bakery-cafes, developing, remodeling and maintaining fresh dough facilities, and for
enhancements of information systems and other infrastructure capital investments. See Note 3 of our Consolidated
Financial Statements for acquisitions of franchise-operated bakery-cafes during 2006. For the fiscal year ended
December 26, 2006, we met our requirements for capital with cash from operations.
We had net working capital of $18.0 million at December 26, 2006 and $15.9 million at December 27, 2005.
The increase in working capital from December 27, 2005 to December 26, 2006 resulted primarily from an increase
in cash of $27.6 million, an increase in prepaid expenses of $6.3 million, and an increase in trade and other accounts
receivable of $5.8 million, partially offset by an increase in accrued expenses of $21.2 million and a decrease in
27